Download
1 / 41
410 likes | 583 Vues
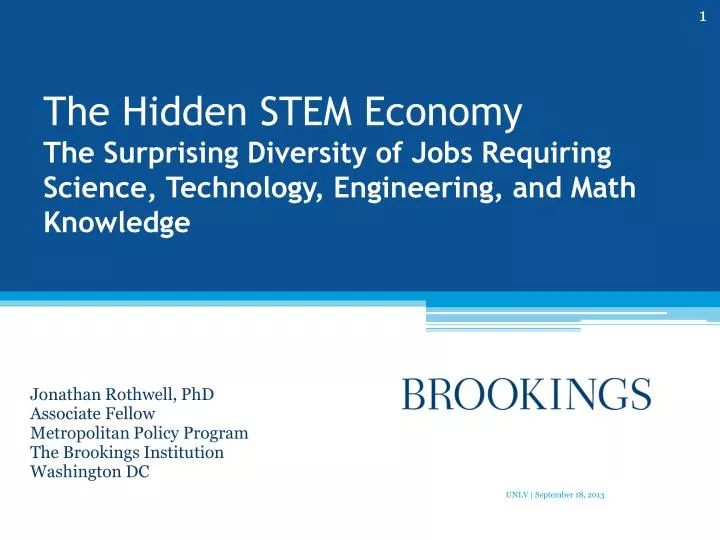
The Hidden STEM Economy The Surprising Diversity of Jobs Requiring Science, Technology, Engineering, and Math Knowledge. Jonathan Rothwell, PhD Associate Fellow Metropolitan Policy Program The Brookings Institution Washington DC. Outline. STEM: The Conventional View

E N D
The Hidden STEM Economy The Surprising Diversity of Jobs Requiring Science, Technology, Engineering, and Math Knowledge Jonathan Rothwell, PhD Associate Fellow Metropolitan Policy Program The Brookings Institution Washington DC UNLV | September 18, 2013
UNLV | September 18, 2013 Outline • STEM: The Conventional View • Redefining the STEM Workforce • The “hidden” STEM economy • The Las Vegas STEM Economy • Policies to boost STEM Demand and Supply
UNLV | September 18, 2013 1. STEM: The Conventional View “There must be a stream of new scientific knowledge to turn the wheels of private and public enterprise. There must be plenty of men and women trained in science and technology for upon them depend both the creation of new knowledge and its application to practical purposes.” -VannevarBush, 1945 From “Science, the Endless Frontier: A Report to the President” (Washington: U.S. Government Printing Office, 1945).
UNLV | September 18, 2013 Innovative High-Patenting Industries are Driving even Measured GDP Growth Tech share of GDP 1980 = 4% 2012 =10% Source: Moody’s Analytics/BEA
UNLV | September 18, 2013 STEM-knowledge drives innovation Source: Brookings analysis of Georgia Tech Inventor Survey, Kauffman Foundation survey, and 2011 American Community Survey
UNLV | September 18, 2013 The Returns to Skill Are Increasing Salary Premium for Bachelor’s Degree vs. High School Diploma compared to Premium for Working in STEM Occupation, 1950-2010 Source: U.S. Census microdata from IPUMS. Regression of ln income on dummy variable for bachelor’s degree (or STEM occupation) controlling for cubic in age and sex for employed workers. Bachelor’s premium compares only BA earners to high school graduates.
UNLV | September 18, 2013 There are many more job openings than graduates for computer, math, and engineering occupations
UNLV | September 18, 2013 2. Redefining the STEM Workforce
UNLV | September 18, 2013 Problems with conventional STEM definitions • No agreement among federal agencies • The NSF uses “Science and Engineering” labor force which roughly corresponds to occupations common to workers with a bachelor’s degree in science or engineering fields. • 2012 BLS task force adopted very similar approach • Dept of Commerce used only part of the NSF definition and added a few occupations to it • Arbitrary standards. • Not based on knowledge or skill requirements, otherwise doctors would be included • Not based on research and development activity, otherwise most computer workers would be excluded, as would social scientists • Class bias? • Computer machine programmers and all blue collar occupations are excluded, but any computer worker in an office settings is counted. • Science lab technicians are often included, but not electricians • What about STEM community college programs, industry certifications, etc?
UNLV | September 18, 2013 The cure is O*NET • Occupational Information Network Data Collection Program • Department of Labor funded data collection program • Provides the most comprehensive database of job attributes by occupation including education, training, experience, skill, knowledge, tools and technologies, interests, and activities
UNLV | September 18, 2013 The Six Core STEM Domains in O*NET Knowledge Survey and Their Survey Anchors Least Knowledge =1 Highest Knowledge = 7 Scales for Science (Physics, Chemistry, Bio), Computers, Engineering, and Math
UNLV | September 18, 2013 New Brookings definition of STEM A STEM occupation is one that requires an extraordinary level of knowledge in one or more core STEM fields. • Extraordinary, here, is defined as at least 1.5 standard deviations above the mean knowledge score for that field (just over 90th percentile), where science fields are grouped together as one • Advantages over standard approach • Non-arbitrary and non-biased • Non-binary • Self-correcting • Comparabilityto other skills
UNLV | September 18, 2013 Results: More jobs, more career pathways to STEM Source: 2011 BLS OES and O*NET
UNLV | September 18, 2013 STEM knowledge is rewarded more than other types of knowledge Marginal Effect of regression of median wages on standard deviation in STEM Knowledge for 719 detailed Occupations, controlling for Mode Education. Source: Brookings analysis of 2011 BLS OES and O*NET
UNLV | September 18, 2013 3. The “hidden” STEM economy
UNLV | September 18, 2013 Literature on Sub-bachelor’s STEM contribution to innovation • During industrial revolution: • Ross Thomson, Structures of Change in the Mechanical Age: Technological Innovation in the United States, 1790 to 1865 (Johns Hopkins University Press, 2009); • Kenneth L. Sokoloff and B. Zorina Khan, “The Democratization of Invention during Early Industrialization: Evidence from the United States, 1790-1846,” Journal of Economic History 50(2) (1990): 363-378; • Jacob Schmookler, “Inventors Past and Present,” Review of Economics and Statistics 39(3) (1957): 321-333. • Presently in terms of lower product defects, higher capacity utilization and efficiency, and R&D quality: • Philip Toner, “Workforce Skills and Innovation: An Overview Of Major Themes In The Literature” (Paris: OECD, 2011)
UNLV | September 18, 2013 Large source of STEM jobs Usually considered 0% STEM
UNLV | September 18, 2013 Both STEM Groups Enjoy a Substantial Skill Premium Beyond Education Note: Mean Sub-BA STEM Wage is $53,000, vs. $33,000 for those non-STEM sub-BA workers Source: Brookings analysis of 2011 BLS OES and O*NET
UNLV | September 18, 2013 Sub-BA STEM jobs are hard-to-fill Share of 2011 job openings re-posted after 30 days in 100 largest metropolitan areas Brookings analysis of Conference Board Help Wanted On-Line and O*NET
UNLV | September 18, 2013 As it happens, STEM metros are: • Richer • More innovative • More export-oriented • More resilient to economic downturn • Employ a larger share of their workers
UNLV | September 18, 2013 5. Where Does Las Vegas Fit In?
UNLV | September 18, 2013 Profile on Brookings website: http://www.brookings.edu/research/reports/2013/06/10-stem-economy-rothwell/profiles
UNLV | September 18, 2013 Las Vegas STEM Premium = 5th highest in largest 100 metros; 22nd of 348
UNLV | September 18, 2013 Source: BLS OES. Groups are sorted by LQ (MSA Share/USA Share). Only occupations with location quotient greater than 1.2 or less than 0.8 are shown.
UNLV | September 18, 2013 Source: O*NET and American Community Survey, 2011 via IPUMS
UNLV | September 18, 2013 5. Policies to boost STEM knowledge
UNLV | September 18, 2013 How to boost demand for STEM • Adopt cluster focus on growing STEM industries • Skills, finance, infrastructure • Foster entrepreneurship • E.g. non-profit incubators • Attract FDI • Tax policy, marketing • Research Universities • R&D budget, SBIR, partnerships with industry • State Fiscal Incentives • R&D tax credits, investment funds
UNLV | September 18, 2013 How to boost the Supply of STEM • Improve K-12 Quality • STEM targeted magnet schools (NYC, Chicago) or high school curriculum (Virginia Beach) or non-profit programs (MESA in California) • Expand capacity of universities and community colleges • Adopt best practices in recruitment & retention • Attract STEM-oriented establishments and their workers • Improve workforce development • Intermediation • Public (WIBs) or private training (apprenticeships)
UNLV | September 18, 2013 More for information Email: Jonathan Rothwell jrothwell@brookings.edu Tweet: @jtrothwell Visit: Brookings homepage: www.brookings.edu Hidden STEM Economy report page: http://www.brookings.edu/research/reports/2013/06/10-stem-economy-rothwell
UNLV | September 18, 2013 Supplemental data
UNLV | September 18, 2013 STEM degree holders are the most likely to be working in jobs related to their field of study Source: Brookings analysis of 2010 National Survey of College Graduates
UNLV | September 18, 2013 STEM occupations earn high and growing wages 8% growth for Computer/Math Occupations Source: Bureau of Labor Statistics Current Population Survey and Consumer Price Index
UNLV | September 18, 2013 Students drop out of STEM majors at higher rates • National longitudinal survey data show 36% of students who start as STEM majors switch to other fields • Data from Ohio Board of Regents show 57% of students who select a STEM major when taking the ACT do not finish as STEM majors • One explanation is that grades are lower than expected • References: Xianglei Chen and Thomas Weko, “Students Who Study Science, Technology, Engineering, and Mathematics (STEM) in Postsecondary Education” (National Center for Education Statistics, 2009); Eric Bettinger, “To Be or Not to Be: Major Choices in Budding Scientists” In Charles T. Clotfelter, ed., American Universities in a Global Market, Chapter 2 (Chicago: University of Chicago Press, 2010); Todd Stinebrickner and Ralph Stinebrickner, “Math or Science? Using Longitudinal Expectations Data to Examine the Process of Choosing a College Major,” Working Paper (The University of Western Ontario, 2012).