Download
1 / 31
610 likes | 1.37k Vues
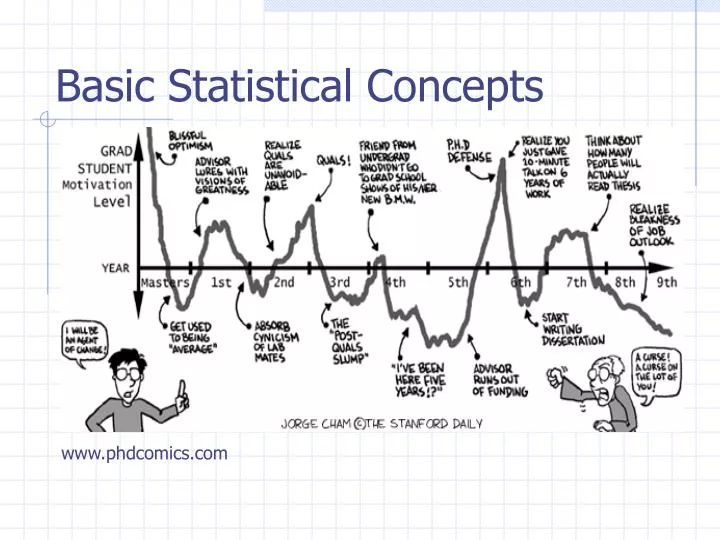
Basic Statistical Concepts. www.phdcomics.com. So, you have collected your data …. Now what? We use statistical analysis to test our hypotheses make claims about the population This type of analyses are called inferential statistics. But, first we must ….

E N D
Basic Statistical Concepts www.phdcomics.com
So, you have collected your data … • Now what? • We use statistical analysis to • test our hypotheses • make claims about the population • This type of analyses are called inferential statistics
But, first we must … • Organize, simplify, and describe our body of data (distribution). • These statistical techniques are called descriptive statistics
Distributions • Recall a variable is a characteristic that can take different values • A distribution of a variable is a summary of all the different values of a variable • Both type (each value) and token (each instance)
Distribution How excited are you about learning statistical concepts? 1 2 3 4 5 6 7 Comatose Hyperventilating 1 2 2 3 4 4 5 6 7 7 Types: 1,2,3,4,5,6,7 9 Tokens: 1,2,2,3,4,4,5,6,7
Distribution 2 1 1 2 3 4 5 6 7 N = 9
Properties of a Distribution • Shape • symmetric vs. skewed • unimodal vs. multimodal • Central Tendency • where most of the data are • mean, median, and mode • Variability (spread) • how similar the scores are • range, variance, and standard deviation
Representing a Distribution • Often it is helpful to visually represent distributions in various ways • Graphs • continuous variables (histogram, line graph) • categorical variables (pie chart, bar chart) • Tables • frequency distribution table
Distribution • What if we collected 200 observations instead of only 9? …
Distribution N = 200 50 40 30 20 10 1 2 3 4 5 6 7
Shape of a Distribution • Symmetrical (normal) • scores are evenly distributed about the central tendency (i.e., mean)
Shape of a Distribution • Skewed • extreme high or low scores can skew the distribution in either direction Negative skew Positive skew
Shape of a Distribution • Unimodal • Multimodal Minor Mode Major Mode
Distribution • So, ordering our data and understanding the shape of the distribution organizes our data • Now, we must simplify and describe the distribution • What value best represents our distribution? (central tendency)
Central Tendency • Mode: the most frequent score • good for nominal scales (eye color) • a must for multimodal distributions • Median: the middle score • separates the bottom 50% and the top 50% of the distribution • good for skewed distributions (net worth)
Central Tendency • Mean: the arithmetic average • add all of the scores and divide by total number of scores • This the preferred measure of central tendency (takes all of the scores into account) population sample
Computing a Mean 10 scores: 8, 4, 5, 2, 9, 13, 3, 7, 8, 5 ξΧ = 64 ξΧ/n = 6.4
Central Tendency • Is the mean always the best measure of central tendency? • No, skew pulls the mean in the direction of the skew
Central Tendency and Skew Mode Median Mean
Central Tendency and Skew Mode Median Mean
Distribution • So, central tendency simplifies and describes our distribution by providing a representative score • What about the difference between the individual scores and the mean? (variability)
Variability • Range: maximum value – minimum value • only takes two scores from the distribution into account • easily influenced by extreme high or low scores • Standard Deviation/Variance • the average deviation of scores from the mean of the distribution • takes all scores into account • less influenced by extreme values
Standard Deviation • most popular and important measure of variability • a measure of how far all of the individual scores in the distribution are from a standard (mean)
Standard Deviation low variability small SD high variability large SD
Computing a Standard Deviation 10 scores: 8, 4, 5, 2, 9, 13, 3, 7, 8, 5 ξΧ/n = 6.4 8 – 6.4 = 4 – 6.4 = 5 – 6.4 = 2 – 6.4 = 9 – 6.4 = 13 – 6.4 = 3 – 6.4 = 7 – 6.4 = 8 – 6.4 = 5 – 6.4 = 1.6 - 2.4 - 1.4 - 4.4 2.6 6.6 - 3.4 0.6 1.6 - 1.4 2.56 5.76 1.96 19.36 6.76 43.56 11.56 0.36 2.56 1.96 SS = 96.4 10.71 3.27
Standard Deviation • In a perfectly symmetrical (i.e. normal) distribution 2/3 of the scores will fall within +/- 1 standard deviation -1 +1 3.13 6.4 9.67
Variance vs. SD • So, SD simplifies and describes the distribution by providing a measure of the variability of scores • If we only ever report SD, then why would variance be considered a separate measure of variability? • Variance will be an important value in many calculations in inferential statistics
Review • Descriptive statistics organize, simplify, and describe the important aspects of a distribution • This is the first step toward testing hypotheses with inferential statistics • Distributions can be described in terms of shape, central tendency, and variability • There are small differences in computation for populations vs. samples • It is often useful to graphically represent a distribution