Download
1 / 17
170 likes | 278 Vues
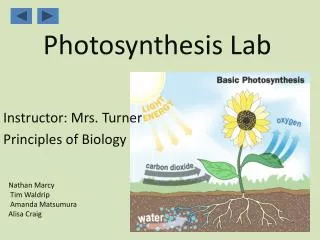
Photosynthesis AP Lab. Dr. Lourdes Rueda. Key Concepts I: Plant Pigment Chromatography.

E N D
Photosynthesis AP Lab. Dr. Lourdes Rueda
Key Concepts I: Plant Pigment Chromatography • Paper chromatography is a technique used to separate a mixture into its component molecules. The molecules migrate, or move up the paper, at different rates because of differences in solubility, molecular mass, and hydrogen bonding with the paper.
For a simple, beautiful example of this technique, draw a large circle in the center of a piece of filter paper with a black water-soluble, felt-tip pen. Fold the paper into a cone and place the tip in a container of water. In just a few minutes you will have tie-dyed filter paper!
The green, blue, red, and lavender colors that came from the black ink should help you to understand that what appears to be a single color may in fact be a material composed of many different pigments —and such is the case with chloroplasts
Design of the Experiment I • In paper chromatography the pigments are dissolved in a solvent that carries them up the paper. In the ink example, the solvent is water. To separate the pigments of the chloroplasts, you must use an organic solvent.
If you did a number of chromatographic separations, each for a different length of time, the pigments would migrate a different distance on each run. However, the migration of each pigment relative to the migration of the solvent would not change. This migration of pigment relative to migration of solvent is expressed as a constant, Rf (Reference front). It can be calculated by using the formula:
Key Concepts II • In the light reactions of photosynthesis, light energy excites electrons in plant pigments such as chlorophyll, and boosts them to a higher energy level. These high-energy electrons reduce compounds (electron acceptors) in the thylakoid membrane, and the energy is eventually captured in the chemical bonds of NADPH and ATP.
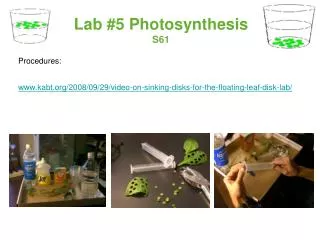
Using DPIP As an Electron Acceptor • In this activity you will measure the rate of electron excitation when light hits chlorophyll. You will use DPIP, a blue compound, as an electron acceptor. The thylakoid membranes of the chloroplasts are mechanically disrupted so that the natural electron transport chain no longer functions normally. • When light strikes the chloroplasts, the DPIP is reduced by the excited electrons from chlorophyll, and it changes from its original blue color to colorless as it accepts the electrons. You will use a spectrophotometer to measure the color change, which gives an indication of the rate of the light reactions of photosynthesis under various conditions
The Spectrophotometer • The spectrophotometer is an instrument that can be adjusted to illuminate a sample with a specific wavelength of light. The spectrophotometer then measures the amount of light energy that is absorbed or transmitted by the sample. In this laboratory, as DPIP goes from blue to colorless, the amount of light of wavelength 605 nm transmitted through the sample will increase. Though you can note this color change visually, the spectrophotometer quantifies the change
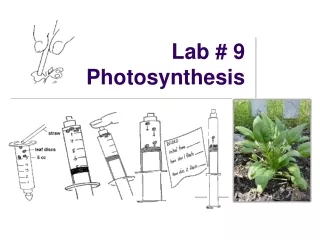
Design of the Experiment II • Pigments absorb in the visible range of the spectrum (380–760 nm). After illuminating the reaction tubes as shown below, we will use the spectrophotometer to measure the percentage of transmittance at wavelength 605 nm.
If DPIP is in an oxidized state, it will be blue, and the percentage of light transmitted will be low. If, on the other hand, chlorophyll's electrons have been excited and move on to reduce the DPIP, the sample will become progressively paler, allowing more light energy to pass through the sample. We can measure this change over time until the sample has been completely reduced, is almost colorless, and the percentage of transmittance is very high.
For this experiment, one tube (the blank) will contain all the solutions used in the reaction except the DPIP. Since the blank contains chloroplasts, it will be green; you will use this tube to calibrate the machine. The other tubes will be experimental, and will contain either boiled or unboiled chloroplasts
Helpful Hints • 1.The first reading provides a baseline. Be sure you read the % transmittance immediately after adding chloroplasts to each experimental tube. • 2.Keep the test tube glass clean! Use a Kimwipe or lens paper to remove your fingerprints. • 3.Thoroughly mix each sample before you measure it. • 4.Be sure to place all the tubes into the spectrophotometer in the same orientation each time so variations in the glass don't mask your results. • 5.Maintain a constant distance from the light source to the sample for all the tubes.