Download
1 / 20
200 likes | 351 Vues
Interim Progress Report #2: “An Analysis of Miami-Dade Transit’s Operating Cost Efficiency” Wednesday, September 7, 2011 @ 2:00 PM. Study Purpose.

E N D
Interim Progress Report #2:“An Analysis of Miami-Dade Transit’s Operating Cost Efficiency”Wednesday, September 7, 2011 @ 2:00 PM
Study Purpose • CUTR will conduct an objective assessment of the relative efficiency of MDT and document actions, activities or policies that have been taken or enacted based on prior work done to assist the agency in creating a more efficient operating environment • CUTR will review operating factors by mode (bus, heavy rail, and automated guideway) and compare results with factors calculated for peer agencies using the methodology outlined in TCRP 141
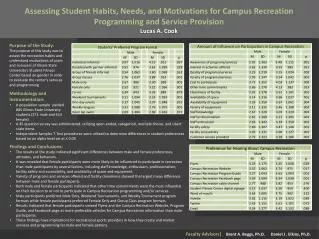
Selected Results – Task 2 - Develop and Compare Operating-cost Data Bus Peers Mover Peers Rail Peers
Bus Results • MDT’s Operating cost per hour is consistent with the peer median and average from 2004 through 2009 • Annual operating cost per bus operated during peak service was consistent with peers from 2004 to 2009 and dropped by 20% in 2010 • Miami’s farebox recovery ratio was better than the peers’. Subsidy per boarding was 53 cents higher than the peer average in 2009 although lower year over year for 2010 • Operating cost per passenger mile compared favorably at 86 cents in 2009, and was reduced to 81 cents in 2010
Bus Results • Miami’s passenger trips and passenger miles were consistently higher than peer averages, but have been dropping since 2008 • Average trip length is increasing and is significantly above peer agencies • The agency requires more labor to deliver service than peers and has made modest progress in the area of miles between failures since 2004
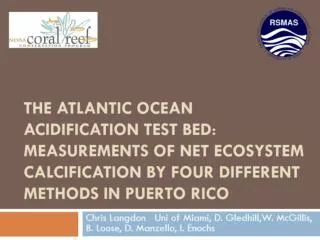
Rail Results • Operating costs per peak vehicle operated exceeds peers since 2004 although reduced from 2009 to 2010 • Operating cost per passenger trip was almost 65% higher than the peer average in 2009 • The subsidy per rail boarding was nearly three times as high as the peer average $1.20 in 2009 (MDT = $3.40) • Revenue miles between failures were significantly below peer agencies • Percentage of operating budget spent on maintenance was fairly consistent with peers
Preliminary Results – Task 1 “Objective assessment of the relative efficiency of MDT - document actions, activities or policies that have been taken based on prior work done to assist the agency in creating a more efficient operating environment”
Service Standards • “Guidelines” in place since 1998 • Recommended standards in November 2005 • BOCC adopted standards September,2009 • Significant changes include: • Service coverage- new criteria for concentrations of transit dependent pop., establishes standards for Expansion Areas • Route Spacing – defines urban core, criteria for weekday, midday, Sunday, weekend core and non-core service • Route Deviation- sets maximum of 125% of length, new deviation standard for underserved areas • Bus Stop Spacing and Amenities • New Headway standards for Bus and Rail • Passenger Loading and Service Span changes • System-wide and Route level Bus Productivity metrics established along with On-time performance standards
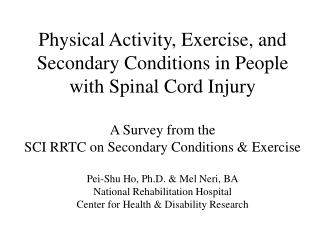
Passengers per Vehicle Mile – Miami Dade Transit 2004 - 2010
Contact Information PI: Jan Davis / Co-PI: Steve Reich Phone: (813) 974-6920 / (813) 974-6435 E-mail: davis@cutr.usf.edu / reich@cutr.usf.edu