Download
1 / 44
440 likes | 591 Vues
KIAA Lectures Beijing, July 2010 Ken Freeman, RSAA, ANU. Lecture 4: stellar data - sources and techniques. Stellar data : the data needed for galactic archaeology and fossil recovery. What are we trying to do:

E N D
KIAA Lectures Beijing, July 2010 Ken Freeman, RSAA, ANU Lecture 4: stellar data - sources and techniques
Stellar data: the data needed for galactic archaeology and fossil recovery What are we trying to do: Evaluate the state of the Galaxy, and understand how it got there : the formation events, role of mergers, infall history, star formation history, dynamical evolution. Need stellar data to compare with theoretical predictions, and to guide the theory
The basic stellar data we need: Magnitudes and colors Distances Motions Chemical properties Ages Look first at what each kind of data can do for us. Then at techniques for acquiring the data
1. Stellar photometry: magnitudes and colors of stars Photometric catalogs are essential input data for stellar observational programs. They give magnitudes and colors for up to billions of stars over the whole sky or very large fractions of the sky. The catalogs typically have photometry in two or more optical or near-IR bands, at different levels of accuracy. They can be used to estimate stellar parameters like temperature and chemicalabundance and distance for vast numbers of stars (more later). From photometric catalogs alone, it is possible to derive useful information about the structure of the Galaxy: eg from the SDSS 5-band ugriz system …
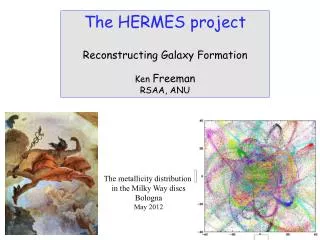
Ivezic et al 2008: Distribution of photometric [Fe/H] and photometric positions in (R,z) for 2.5 x 10⁶ SDSS FG stars • planar stratification of [Fe/H] • Mon stream
2. Stellar distances: where do the stars lie in the Galaxy. We need stellar distances to • measure transverse velocities from proper motions. • compute stellar orbits • map substructure in the halo and disk. • measure structure and dynamics of the galactic components • calibrate luminosities of different kinds of stars
3. Stellar motions: How are different kinds of stars moving in the Galaxy ? The data: radial velocities, proper motions, 3D velocities. What insights do we get from kinematics of stars: • how energetic are they • how far are stars from circular motion • what is the sense of their angular momentum - prograde or retrograde • are spatial distributions and kinematic distributions consistent (use Jeans’ equations) • evolution of stellar orbits - how do orbital properties correlate with age, metallicity • kinematic substructure: moving stellar groups • measure the density of matter near the sun (no dark disk ?) • derive dark matter distribution using distant stars
retrograde prograde Lindblad diagram for RR Lyrae stars (Morrison) shows • very energetic halo stars • retrograde halo stars • the disk RR Lyr close to the prograde circular orbit locus E and Lz are both integrals of the motion in a steady-state axisymmetric galaxy you are here Lz (km s-1 kpc)
thick disk thin disk Toomre diagram (Bensby) for stars of thin (o) and thick (•) disks (U V W) are stellar velocities relative to the Local Standard of Rest: V is in the sense of galactic rotation
If we know the 3D location and velocity for a star, and have a reliable model for the Galactic gravitational potential, then we can compute the star’s Galactic orbit plane view edge-on view Orbits show Galactic region visited by the star. Stars from the inner and outer Galaxy can pass through the solar neighborhood. Knowing the orbit is not always very useful for Galactic archaeology. Stellar orbits can evolve as the star interacts with spiral structure and giant molecular clouds. Resonances can flip a star from one near-circular orbit to another.
4. Stellar element abundances The element abundances of stars come initially from the abundances in the gas from which they formed. This gas has been enriched by previous generations of evolving and dying stars. Different components of the Galaxy (halo, bulge, thick disk, thin disk) each have different characteristic chemical properties: eg the halo stars are mostly metal poor (-1 > [Fe/H] > -5), while the thick disk stars are more metal rich (-0.5 > [Fe/H] > -2) and are enriched in -elements.
light s heavy s r process Different element groups come from different progenitors. • the Fe-peak elements come mainly from type Ia SN • the - and r-process elements come mainly from the more massive type II SN • the s-process elements come mainly from thermally pulsing AGB stars The cosmic abundance distribution
Light s Heavy s Truran et al 2002
The abundances of different element groups in stars can tell us a lot about the star formation history which led to the formation of these particular stars: eg -enrichment relative to Fe indicates that SNII were important for the chemical evolution and the star formation history was fairly rapid: Fe-enrichment from SNIa (which take ~ 1 Gyr to evolve) was less important. For most of the heavier elements, stars remember the abundances with which they are born. Groups of stars born together, like open star clusters, can have almost identical abundances, reflecting the abundances of the gas from which they formed. Chemical signatures may allow us to recognize groups of stars which were born together but have dispersed and drifted apart (chemical tagging). The number of independently varying elements is ~ 7-9 : this is the dimensionality of chemical space
Clusters vs nearby field stars Hyades Coll 261 HR1614 Clusters have small abundance spread: The mean is different from cluster to cluster De Silva 2007
5. Stellar ages: Stellar ages let us evaluate when events occurred. They are important for measuring the star formation history and for understanding how the metallicity and dynamics of different groups of stars have evolved: e.g. how has the star formation rate and the kinematics and the metallicity of the thin disk near the sun changed from 10 Gyr ago to the present time ? Stellar ages are still difficult to measure and lead to much uncertainty about the evolution of the Galaxy. Measuring stellar ages is one of the most important goals for the future.
star formation history in galactic thin disk near the sun : roughly uniform, with episodic star bursts for ages < 10 Gyr, but lower for ages > 10 Gyr (stellar ages are chromospheric) Rocha-Pinto et al (2000)
1. Photometric catalogs (groundbased: not a complete list) 2MASS whole sky, JHK shallow SDSS 8000 sq deg, mainly northern sky, ugriz UKIDSS 7500 sq deg of northern sky, YJHK SkyMapper whole southern sky, uvgriz Pan-STARRS 30,000 sq deg, mainly northern sky, grizy VISTA VHS: whole southern sky, JK LSST: optical whole southern sky, ugrizy
2. Techniques for measuring distances Trigonometric parallaxes: From the ground: accuracy is ~ few milli-arcseconds, so gives distances with 10% error out to about 30 pc From space: Hipparcos ~ 1 mas, useful to about 100 pc GAIA: ~ 10 as at V = 14: i.e 1% distance accuracy (but magnitude dependent). Useful to about 10 kpc Trigonometric parallaxes provide the fundamental distance scale for astronomy
Photometric parallaxes: Use theoretical or empirical isochrones to estimate the absolute magnitude and hence the distance of the star Need: • abundance [Fe/H] • estimate of Te : color or spectroscopic Te • estimate of L or surface gravity : dwarf, giant, spectroscopic or photometric log g • assumption about age. The more you know, the better this works. If all you know is a color, the errors can be very large. Can achieve 10-15% distance errors in best cases where errors are ~ 0.1 in [Fe/H], 100K in Te and 0.1 in log g For a few kinds of stars (RR Lyrae, cepheids, BHB stars), accurate absolute magnitudes are known, so errors in photometric distances can be as low as a few percent.
Dartmouth isochrones For clusters, can fit theoretical isochrones to color-magnitude diagrams to derive age and distance, if [Fe/H] is known. For globular clusters with horizontal branch stars or RR Lyrae stars, these stars can be used as standard candles: their absolute magnitudes are fairly well determined. Padova, Teramo isochrones CMD for globular cluster Kron 3 in SMC: HST/ACS data (Glatt et al 2008)
Schlegel l = 32, b = 2 Interstellar reddening and extinction is a problem for photometric parallaxes, less in the near-infrared. Multicolor photometry can give independent stellar reddening estimates. Schlegel maps (from COBE IR images of Galaxy) give asymptotic reddening out to large distances all over sky. For individual stars, diffuse interstellar bands give independent reddening estimate. Munari DIB E(B-V)
3. Techniques for measuring stellar velocities Radial (line of sight) Doppler velocities are measured spectroscopically Proper (transverse) motions are measured astrometrically Radial velocities Typical accuracies range from 1 m/s at R = /~ 50,000 to 1 km/s at R ~ 7000 (RAVE) to 5 km/s at R ~ 2000 (SEGUE). 5 km/s is good enough for most Galactic programs. Samples of ~5.105 stellar radial velocities are or will soon be available from large fiber spectrograph surveys: SDSS, SEGUE, LAMOST (much more) The spectra also give estimates of stellar parameters: Te, log g, [Fe/H]
Proper motions: From the ground: accuracy can be a few mas/yr ie ~ 20 km/s at 1 kpc. Very large samples (105 to 109 stars) from USNO, UCAC2, SPM, SDSS, 2MASS, GSC, PM2000, PPMXL …. with more to come from Pan-STARRS, SkyMapper, LSST…. From space: Hipparcos, Tycho, 2 x 10⁶ stars, accuracy ~ 2 mas/yr GAIA, 109 stars, accuracy ~ 10 as/yr at V = 14 (magnitude dependent) i.e ~ 0.7 km/s at 15 kpc. GAIA will really change Galactic astrophysics, with vast numbers of very precise parallaxes and proper motions. We should be prepared to get the most from this resource. Launch is due 2012 Other planned astrometric missions include SIM (pointed, 4 as/yr) and JASMINE (galactic plane and bulge, 4 as/yr)
4. Techniques for measuring chemical abundances Intermediate and broad band CCD photometry like Strömgren photometry and SDSS/SkyMapper photometry gives estimates of stellar temperature, gravity, abundance: abundance errors ~ 0.3 in metallicity [M/H] Black = SDSS Color = SkyMapper Geneva-Copenhagen catalogs: 14,000 FG dwarfs with Strömgren photometry, Hipparcos astrometry and accurate radial velocities ( Nordstrom et al 2004, Holmberg et al 2007)
Medium resolution spectroscopy (R ~ 2000 - 7000) measures strengths of spectral features: eg the RAVE and SEGUE surveys of several x 105 stars. Gives [Fe/H] and maybe [/Fe] and other elements. [Fe/H] errors ~ 0.15 spectrum Ca triplet region R = 7500 350,000 stars with I < 12 observed so far
High resolution spectroscopy(R ~ 20,000 - 80,000) High resolution spectrum (R ~ 80,000) 17A window on the Sun revealing detailed chemistry of Fe, Cr, Ti, V, Co, Mg, Mn, Nd, Cu, Ce, Sc, Gd, Zr, Dy
High resolution spectrographs are usually echelle spectrographs, some with MOS fiber capability - typically with a few hundred fibers: (Hectochelle on MMT, MIKE on Magellan, FLAMES/GIRAFFE on VLT exist already; HERMES on AAT, APOGEE on Sloan coming, aimed at large surveys of 105 to 106 stars) High resolution spectroscopy is the only way now to measure accurate abundances of many different elements including neutron capture elements (s-process, r-process). Analysis is currently laborious but this will change with pipelines for high-resolution surveys of large samples of stars to start ~ 2011: HERMES 106 stars at R ~ 30,000 in optical, higher latitudes APOGEE 105 stars at R ~ 20,000 in H-band, lower latitudes Large catalogs of high resolution abundances for nearby stars: Compilations by Venn et al 2004: 781 stars Soubiran & Girard 2005: 743 stars
For large optical high-resolution surveys, FGK stars with Te = 5000-6500K will be used: cool enough to have plenty of lines and warm enough for analysis to be fairly straightforward. Hotter stars have mostly weaker metallic lines and are often younger and rotating which broadens the lines and makes weak lines difficult to measure. Cooler stars have complex atmospheres with molecules : more difficult in optical, better in the near-IR, which is also much less affected by interstellar extinction. Not so good for neutron capture elements (heavier than Fe-peak). (Almost every topic in the above paragraphs is a major specialty in stellar astrophysics: the subject of much work and individual careers)
5. Techniques for measuring stellar ages • Nuclear cosmochronology: compare ratios of radioactive and stable species to expected ratios from theory: eg U/Th. Not widely used yet: age errors are ~ 20% • Asteroseismology: stellar oscillation frequencies depend on density dstribution in stellar interior, which changes as the star ages. The asteroseismology space missions (MOST, CoRoT, Kepler) will contribute greatly to deriving stellar ages with 5-10% errors.
• Age indicators based on stellar rotation and activity(useful for main sequence stars: see review by Barnes (2007). Calibrated on star clusters and Sun. Stars spin down with age: rotation period t1/2. Rotation period can be used to estimate age- usually measured photometrically (Kepler, COROT) . Called gyrochronology Chromospheric emission: chromospheric activity (associated with rotation) decreases with age. Much used in past but believed to be less accurate for older stars. Measured from Ca K emission.
Gyro ages vs chromospheric ages for a sample of well studied stars (Barnes 2007). Ignore the blue crosses - stars bluer than B-V = 0.6
White dwarf luminosity function: useful for getting ages of a population (eg disk or halo) or for a globular cluster. Uses the cooling and fading of white dwarfs as age estimator for the population.
age = 9 Gyr The luminosity function of white dwarfs in the nearby disk Legget et al 1998
White dwarf luminosity function ages for the Galactic disk and two globular clusters M4 and NGC 6397: the disk is clearly younger (Hansen et al 2007)
log age subgiants If no parallax, can use isochrones in the log g - Te plane: . [Fe/H], log g and Te can be derived from analysis of high resolution spectra or low resolution spectrophotometry Isochrone ages Trigonometric parallax gives MV which gives L after bolometric correction. Photometry gives Te. Now compare location of star in L-Te plane with theoretical isochrones: [Fe/H] is needed. Isochrones can give ages if star is in region of L-Te plane where L, Te depend on age : i.e not on the lower main sequence, and better not on the upper giant branch. Evolved stars still close to the main sequence require accurate Te. Subgiants are good. GAIA will provide a huge increase in accurate isochrone ages: 1% distances at V = 14
Large biases can occur for isochrone ages if errors are significant, because the underlying distributions of stellar mass and abundance are not uniform. Bayesian techniques can include these underlying distributions as priors. See Pont & Eyer (2004)
There is still much disagreement about stellar age estimates Edvardsson et al (1993) ages for subgiants Nordstrom et al (2004) ages Stars mostly near main sequence [Fe/H] and Te from Strömgren photometry against isochrone ages from Valenti & Fischer (2005) Measuring accurate stellar ages is difficult (Reid et al 2007)
Dartmouth isochrones For clusters, can use isochrone fits to derive the age and distance: needs [Fe/H]. e.g ACS survey of Galactic Globular Clusters See coeval clusters over whole [M/H] range, plus younger outer clusters with age-metallicity relation
Sources of models Isochrones: Bertelli, Girardi et al 1994 - 2008 (Padova) Dotter, Chaboyer et al 2002-2008 (Dartmouth) VandenBergh et al 2006 (Victoria-Regina) Cassisi, Castelli et al 2004-2008 (Teramo) Maeder, Meynet et al 1989-2008 (Geneva) Most isochrone libraries cover a wide range of stellar mass, age, [Fe/H], [/Fe] and give magnitudes and colors in several widely-used photometric systems. Some include stellar rotation
Stellar atmospheres Kurucz et al ATLAS9 (1992 - 2010) e.g. Zwitter et al 2004, Munari et al 2005 MARCS (… - 2010) LTE models: give flux vs wavelength at various spectral resolutions for wide range of stellar parameters: Te, log g, abundance [Fe/H], [/Fe], [C/N], [N/Fe], [O/Fe], microturbulence. These atmospheres are widely used for estimating abundances and other stellar parameters by comparison with observed spectra. e.g. the RAVE pipeline works by fitting the observed spectra (R ~ 7000, SNR ~ 40) from the Ca triplet region to the grid of Zwitter et al models - the internal accuracy is about 0.1 in [M/H], 0.2 in log g and 135 K in Te. This is also the way of the future for analysing industrial-level high resolution spectra
Galactic models: The Besançon model (Robin et al) includes several galactic components, each with prescribed distribution of stellar ages, motions and chemical properties. A reddening recipe is included. You specify the galactic region (l, b, distance), and the age and magnitude range. The model generates mock catalog of stars in that region, and tabulates the stellar parameters: Te, log g, [Fe/H], kinematics, photometry. The model is very useful for preliminary simulations of observational programs, and for sanity check on outcomes. One could argue about some of the basic empirical input parameters for the model, but it seems to work reasonably well.
ESA-ESO Working Group Report #4: Galactic Populations, Chemistry and Dynamics (Turon & Primas) This is a very useful compendium of the major problems in Galactic astronomy, ways to attack them, and major surveys past, present and future.