Download
1 / 36
360 likes | 512 Vues
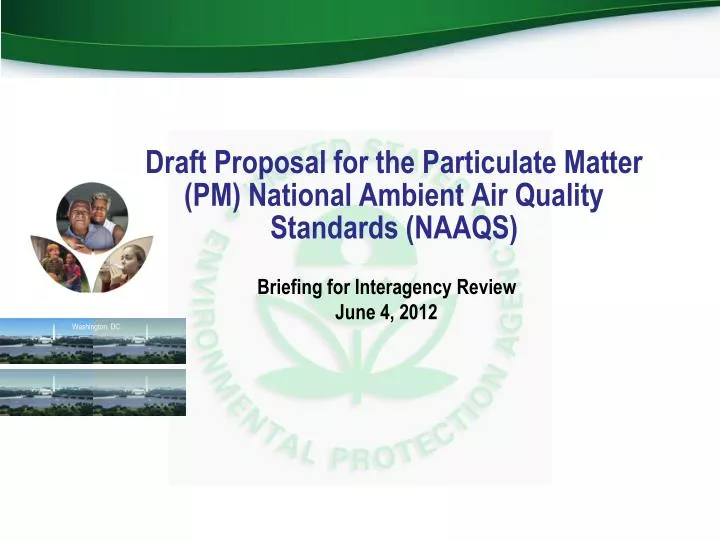
Washington, DC. Draft Proposal for the Particulate Matter (PM) National Ambient Air Quality Standards (NAAQS). Briefing for Interagency Review June 4, 2012. Overview of Briefing. Schedule Current PM standards Overview of proposed decisions Primary standards for fine particles

E N D
Washington, DC Draft Proposal for the Particulate Matter (PM) National Ambient Air Quality Standards (NAAQS) Briefing for Interagency Review June 4, 2012
Overview of Briefing • Schedule • Current PM standards • Overview of proposed decisions • Primary standards for fine particles • Primary standard for thoracic coarse particles • Secondary standards
Current PM Standards • PM2.5 Primary • Annual standard with a level of 15 µg/m3 • 24-hour standard with a 98th percentile form and a level of 35 µg/m3 • PM10Primary • 24-hour standard with a 1-expected-exceedance form and a level of 150µg/m3 • Secondary • Identical to primary PM2.5 standards
Overview of Proposed Decisions • Fine Particles – Primary PM2.5 Standards • Propose to revise annual standard level to 12 µg/m3 in conjunction with retaining 24-hour standard level at 35 µg/m3 • Thoracic Coarse Particles - Primary PM10 Standard • Propose to retain the current standard • Secondary PM2.5 Standard • Propose a new standard defined in terms of a PM2.5 visibility index, with an averaging time of 24 hours, a 90th percentile form, and a level of either 30 or 28 dv
Fine Particles: Significant Impacts on Public Health • Nationally, based on PM2.5 air quality in 2005, we estimate: • Premature mortality: • 130,000 - 320,000 excess deaths in adults • 5.4% of all deaths related to PM2.5 exposures • Impacts among children: • 110,000 emergency department visits related to asthma (less than 18 years of age) • 200,000 cases of acute bronchitis (age 8-12) • 2,500,000 cases of exacerbation of asthma (age 6-18) • Impacts among adults: • 18,000,000 loss work days (age 18-65) • 180,000 heart attacks (age 17 and older) • 83,000 cases of chronic bronchitis (age 26 and older) • 62,000 hospitalizations for cardiovascular effects (age 17 and older) • 30,000 hospitalizations for respiratory effects (all ages) • In addition, recent research provides evidence that decreases in long-term PM2.5 exposures have been associated with an estimated increase in mean life expectancy of approximately 5 to 9 months
Fine Particles: Estimated National Impacts…Premature Mortality
Fine and Coarse Particles: Susceptible Populations • Primary standards are to be set to protect public health, including susceptible populations, with an “adequate margin of safety” • A variety of factors make people more susceptible to PM-related health effects, including: • Pre-existing diseases (such as heart or lung disease, including asthma) or conditions (such as obesity) • Lifestage • Older adults • Children • Persons with lower socio-economic status (SES) • New evidence available in this review provides stronger evidence for this population • Emerging evidence for additional susceptible populations related to: • Genetic differences • Additional pre-existing diseases and conditions (such as diabetes) • Pregnancy, newborns
Fine Particles: History of the Primary PM2.5 Standards • 1997: Fine and coarse fractions of PM10 considered separately; EPA set initial fine particle standards using PM2.5 as indicator • 2006: Retained level of annual standard (15 µg/m3); revised level of 24-hour standard (65 µg/m3 lowered to 35 µg/m3) • Annual standard: Based level on long-term exposure studies only (Harvard Six Cities and American Cancer Society (ACS) studies); key morbidity studies in children judged to be too uncertain a basis for establishing a lower level (e.g., S. California Children’s Health Study) • 24-hour standard: Based level on short-termexposure studies only • CASAC had recommended revising annual standard level within a range of 13-14 µg/m3 in conjunction with revising 24-hour standard level within a range of 30-35 µg/m3;following final rule, CASAC expressed serious concerns with decision to retain annual PM2.5 standard level • 2009: US Court of Appeals, DC Circuit issued decisions on 2006 PM standards • Concluded “EPA failed adequately to explain why, in view of risks posed by short-term exposures and the evidence of morbidity resulting from long-term exposures, its annual standard is sufficient to protect public health with an adequate margin of safety” • Remanded annual standard for further consideration of whether it provides an adequate margin of safety, especially in children and other susceptible populations • Primary 24-hour PM2.5 standard, as revised in 2006, was not challenged by litigants
Fine Particles: Overview of Health Effects Evidence Based on ORD’s PM Integrated Science Assessment (ISA), which CASAC has endorsed: • Extensive new epidemiological evidence is now available, including: • Extended analyses of seminal studies of long-term PM2.5 exposures • Substantial increase in new U.S. multi-city, long- and short-term exposure studies • Additional types of evidence from controlled human exposure and animal toxicological studies provide support for effects observed in epidemiological studies • Compelling evidence supports a causal relationship between PM2.5 and premature mortality and cardiovascular effects (long- and short-term exposures) • Additional evidence for a broad range of PM2.5-related health effects supports: • Likely causal relationship for respiratory effects (long- and short-term exposures) • Suggestive of a causal relationship for developmental/reproductive effects, cancer (long-term exposures) • Evidence is not sufficient to link health effects with any specific fine particle component or group of components associated with any source categories of fine particles nor to exclude any component(s) from the mix of particles included in PM2.5 indicator • No evidence of a discernible threshold below which health effects would not occur
Fine Particles: Overview of Epidemiology Evidence Long-term Exposure “Cohort” Studies • Follows a specific group of study participants (“cohort”) over time and across urban areas; PM2.5 concentrations over years are associated with specific health events (e.g., deaths) across cities • Extended follow-up of important studies as well as new studies are largely consistent with previous reports of premature mortality at lower ambient PM2.5 concentrations; provide stronger evidence of morbidity effects • Studies of note include: • Extended analyses of ACS and Harvard Six City studies (premature mortality) • Extended analyses of S. California Children’s Health Study (decreased lung function growth) • Women’s Health Initiative Study (WHI, cardiovascular-related mortality and morbidity effects observed in healthy, post-menopausal women) • Medicare Air Pollution Study (MCAPS, premature mortality, older adults) Short-term Exposure Studies • “Time-series studies” consider general population or a subset (e.g., Medicare participants) in a single city or across multiple cities over several years; daily changes in PM2.5 concentrations (one or more days) are associated with daily changes in events (e.g., deaths, hospitalizations) • New multi-city studies greatly expand and reinforce evidence of mortality and morbidity effects available in last review; studies of note include: • MCAPS (hospitalizations for cardiovascular and respiratory disease, older adults) • 112 U.S. Cities study (premature mortality)
Fine Particles: Translating Evidence into Primary PM2.5 Standards (1) • In translating evidence into basis for standard levels, we focus on epidemiological evidence: • Recognize health effects may occur over the full range of concentrations observed in epidemiological studies; there is no evidence of a discernible threshold below which health effects would not occur • Controlled human exposure studies help to demonstrate causality but, unlike in other recent NAAQS reviews, are not helpful for setting the level of the PM2.5 standards • Rely primarily on annual standard to provide protection from both long- and short-term PM2.5 exposures, with 24-hour standard providing supplemental protection against high peak concentrations • Considered most effective and efficient approach for providing public health protection • Supported by results from quantitative risk assessment • Annual standard level (see figure on next slide) • Focus on identifying levels somewhat below long-term mean concentrations reported in epidemiological studies (general approach used in previous reviews) • Consider broader distribution of PM2.5 concentrations beyond a point “somewhat below the mean” to consider ranges of concentrations that were most influential in generating health effect estimates in epidemiological studies, as CASAC strongly advised us to do
Fine Particles: Translating Evidence into Primary PM2.5 Standards(2) Level of current annual PM2.5 standard Long-term Mean PM2.5 Concentrations (50th percentiles) ♦ =long-term exposure studies; causal or likely causal relationship ▲= short-term exposure studies; causal or likely causal relationship ■ = long-term exposure studies; suggestive of a causal relationship • Distributional Statistics of Health Event and/or Study Population Data 25th percentile 10thpercentile Source: Policy Assessment for the Review of the PM NAAQS, April 2011, Figure 2-8 • Additional studies report effects at higher long-term means • More limited and mixed evidence is available from single-city, short-term exposure studies with long-term mean PM2.5 concentrations below 15 µg/m3 Long –term mean PM2.5 concentration (µg/m3)
Fine Particles: Staff Conclusions in Final Policy Assessment
Fine Particles: CASAC Advice Adequacy of Current Standards • CASAC concludedcurrent standards are “not protective”and there are “significant public health consequences”at the current levels of the standard(s) that “justify consideration of lowering the PM2.5 NAAQS further” Alternative Standards Appropriate to Consider • CASAC agreed with staff’s approach to focus on annual standard • CASAC concluded that alternative annual standard levels within a range of 13 to 11 µg/m3 and 24-hour standards levels within a range of 35 to 30 µg/m3“are supported by the epidemiological and toxicological evidence, as well as by the risk and air quality information” • Based on 2nd draft Policy Assessment, which did not include consideration of analyses of the broader distribution of PM2.5 concentrations beyond a point “somewhat below the mean” to consider ranges of concentrations that were most influential in generating health effect estimates in epidemiological studies
Fine Particles: Draft Proposal and Considerations • Propose to reviseannual standard level to 12 µg/m3 in conjunction with retaining 24-hour standard level at 35 µg/m3 • Solicit comment on alternative annual standard levels from 13 to 11 µg/m3 Considerations: A focus on an annual standard level of 12 µg/m3: • Places greatest weight on both long- and short-term exposure studies providing evidence of effects classified as having a causal or likely causal relationship • Below the lowest long-term mean concentrations reported in all multi-city studies that reported statistically significant associations (i.e., below 12.8 µg/m3) • Places littleweight on more limited evidence from multi-city, long-term exposure studies for which we have suggestive evidence of a causal relationship for developmental effects • In conjunction with lowering the annual standard level to 12 µg/m3, the evidence most strongly supports retaining 24-hour standard level at 35 µg/m3 • Changes in air quality designed to meet a lower annual standard would likely result not only in lower annual average PM2.5 concentrations but also in fewer and lower peak 24-hour PM2.5 concentrations • Thus, additional protection would be provided by a revised annual standard such that revision to the 24-hour standard is not warranted
Fine Particles: Considerations (Continued) • Requesting comment on an annual standard level up to 13 µg/m3 : • Places weight on most, but not all, multi-city studies; however, we have no basis for excluding studies with long-term mean concentrations of 12.8 or 12.9µg/m3 • Places no weight on considering the broader distribution of PM2.5 concentrations down through which we continue to have confidence in observed associations or on the more limited evidence of serious effects in susceptible populations(e.g., infant mortality, low birth weight) • Places substantial weight on the remaining uncertainties and limitations in the evidence • In conjunction with lowering the annual standard to 13 µg/m3, the evidence provides limited support for also lowering the 24-hour standard level • An annual standard of 13 µg/m3 (absent a very low 24-hour standard level) could raise issues similar to those which resulted in the remand of the 2006 PM2.5 annual standard • Requesting comment on an annual standard level down to 11 µg/m3: • Places greater weight on considering the range of PM2.5 concentrations below the long-term mean concentrations down through which we continue to have confidence in observed associations • Places considerably more weight on limited evidence of serious effects in susceptible populations providing evidence suggestive of a causal relationship • Places less weight on the remaining uncertainties and limitations in the evidence • In conjunction with lowering the annual standard level to 11 µg/m3, the evidence most strongly supports retaining 24-hour standard level
Costs and Benefits for Proposed Primary PM2.5 Standards (12/35) • In setting NAAQS, EPA may not consider implementation costs. Per Executive Order 12866 and standard practice, EPA has conducted a Regulatory Impact Analysis for informational purposes only. • Costs are low because they consider federal measures already in place including recently promulgated regulations (e.g., CSAPR and MATS) and controls applied to meet the current standards (15/35). • Emission control measures were applied to sources of PM2.5, SO2, and NOx (few thousands of tons) for meeting proposed alternative standards (12/35). *Estimated costs and benefits are additional to those associated with meeting the current standards. Currently, we are performing QA on the cost and benefit estimates. A new version of the RIA with updated estimates will be provided in the next few weeks. We anticipate there will be an increase in the costs; however, the benefits are still expected to significantly exceed the costs.
Current and Projected PM2.5 Nonattainment *Nonattainment areas may include multiple counties or only a part of one county. **Estimated/projected conditions are for illustrative purposes only. Assuming revised PM NAAQS are promulgated in June 2013, designations would be based on 2011-2013 or 2012-2014 air quality data.
2008-2010 PM2.5 Concentrations by CountyProposed Standards: Annual NAAQS level = 12 µg/m3/24-hr NAAQS level = 35 µg/m3 Note: This slide represents recent air quality conditions but not necessarily the areas likely to be designated as attainment/nonattainment. For illustrative purposes, assuming revised PM NAAQS are promulgated in June 2013, designations would be based on 2011-2013 or 2012-2014 air quality data.
Proposed Primary Standards: Annual NAAQS level = 12 µg/m3/24-hr NAAQS level = 35 µg/m3 2020 Projected PM2.5 Concentrations by County with ‘on the books’ Federal controls Projected design values indicate 18 counties are likely not to meet one or both of the proposed primary PM2.5 standards in 2020.
Coarse Particles: History of the PM10 Standard • 1987: EPA first set PM10 standards in order to protect against exposures to particles that can penetrate deeply into the respiratory system • 24-hour standard: Form set at one-expected-exceedance and level set at 150 µg/m3 • Annual standard: Level set at 50 µg/m3 • 1997: Given newly established fine particle standards, purpose of PM10 standards became to protect against the coarse fraction of PM10 (i.e., PM10-2.5) • Following litigation, the 1987 PM10 standards remained in place • 2006: EPA retained the 24-hour standard and revoked the annual standard • Decision on annual standard based on insufficient evidence linking health problems to long-term exposure to inhalable coarse particle pollution • In subsequent litigation, DC Circuit court upheld decisions and supporting rationale for PM10 standard • Today’s 24-hour PM10 standard is the same as that set in 1987
Coarse Particles: ISA Conclusions • Causality: The available evidence is “suggestive”of a causal relationship between short-term thoracic coarse particle exposures and mortality, respiratory effects, and cardiovascular effects • “Suggestive,” rather than “causal” or “likely causal”, reflects the greater degree of uncertainty associated with the health evidence for PM10-2.5 • Composition: Evidence is not sufficient to link health effects with specific sources or components of PM10-2.5 (such as those typical of urban versus rural areas)
Coarse Particles: Health Evidence • In epidemiologic studies, associations between PM10-2.5 and mortality/morbidity were generally positive, with some being statistically significant • In the subset of studies that employed co-pollutant models to evaluate the potential for confounding, PM10-2.5 effect estimates remained positive, and in a few cases statistically significant • Single-city analyses reported positive and statistically significant associations in a few urbanlocations that would have met the current PM10 standard during the study period • Detroit (Ito et al., 2003) • Toronto (Lin et al., 2002) • Birmingham, Chicago, Pittsburgh (ISA, based on Zanobetti and Schwartz, 2009) • A few recent dust storm studies have reported associations between mortality or morbidity and PM of non-urban, crustal origin • Associations were positive with some being statistically significant • Mostly non-U.S. studies • PM10 concentrations in these study locations likely well above those allowed by the current PM10 standard
Coarse Particles: Uncertainties and Limitations • Extent to which thoracic coarse particles themselves, rather than one or more co-occurring pollutants, are responsible for health effects reported in epidemiologic studies • Relatively small number of studies that have evaluated co-pollutant models and supporting experimental studies • Extent to which PM10-2.5 concentrations measured at central-site monitors reflect exposures in study populations • Relatively limited spatial coverage provided by existing PM10-2.5 monitors combined with the relatively large spatial variability in ambient PM10-2.5 concentrations • Tends to decrease the likelihood that an association between PM10-2.5 and health effects would be detected, even if such an association exists • Measurements of coarse particle concentrations at which reported health effects occur • Given the lack of a national monitoring network for PM10-2.5, different health studies have used different approaches to estimate or measure thoracic coarse particles and it is not clear how these different methods relate to each other • Extent to which coarse particle composition affects particle toxicity • Lack of information on PM10-2.5 composition makes it difficult to characterize the variability in health effect associations with thoracic coarse particles • Lack of quantitative estimates of PM10-2.5-associated health risks • Evidence judged insufficient to support quantitative risk assessment, adding to uncertainty regarding potential public health implications of retaining versus revising the current standard
Coarse Particles: Staff and CASAC Conclusions on the Current Standard Staff conclusion in Policy Assessment: Consider either retaining or revising the current standard, depending on the weight placed on the evidence and its associated uncertainties Retain: Focuses on the“suggestive”nature of the PM10-2.5 health evidence Revise: Places more weight on the results of specific studies, particularly those reporting associations with PM10-2.5 in locations that would have met the current PM10 standard, and less weight on the “suggestive” nature of the evidence CASAC concluded that the available evidence, while limited, is sufficient to call into question the level of protection provided by the current standard CASAC placed weight on studies reporting associations with PM10-2.5 in locations that would have met the current PM10 standard, results from co-pollutant models, and controlled human exposure studies CASAC did not discuss the role that the“suggestive” nature of the evidence played in reaching their conclusion on the adequacy of the current standard
Coarse Particles: Staff Conclusions on Potential Alternative Standards Final Policy Assessment: Appropriate to consider revising the form and the level Form: 98th percentile of the annual distribution of 24-hour PM10 concentrations, averaged over 3 years Based on analyses in the final Policy Assessment, a 98th percentile form could better target public health protection to locations with higher coarse particle concentrations and to locations where we have more confidence in associations with health effects and… Could be less influenced by relatively rare events that can result in high PM10 concentrations on a small number of days in a year Level: 85 µg/m3 to 65 µg/m3, with the upper end of the range supported by the strongest health evidence 98th percentile 24-hour PM10 concentrations in U.S. study locations were above 85µg/m3 in locations where positive and statistically significant PM10-2.5 effect estimates have been reported Based on analyses in the final Policy Assessment, standard levels from 85 µg/m3 to just above 75 µg/m3could be considered “generally equivalent” to the current PM10 standard Even such “generally equivalent” standard levels could better target public health protection, compared to the current standard
Coarse Particles: CASAC Conclusions and Recommendations on Potential Alternative Standards CASAC recommendations are based on the 2nd draft Policy Assessment, which did not include the analyses of targeting public health protection These analyses were conducted in response to CASAC comments and were included in the final Policy Assessment Form: CASAC “strongly” recommended revising the form to the 98th percentile Level: CASACagreed that standard levels from 85 (a level that could be “generally equivalent” to current standard) to 65 µg/m3 could be justified; however, they recommended setting the level in the range of 75 to 65 µg/m3 CASAC recommended revising to increase public health protection CASAC concluded that a level at or below 75 µg/m3 would result in increased public health protection across the U.S. CASAC noted that margin of safety considerations could justify a PM10 standard level at or below 75 µg/m3
Coarse Particles: Draft Proposal and Considerations Propose to retain the current standard In addition, in light of CASAC’s recommendations, the draft proposal welcomes the public’s views on different approaches to considering and accounting for the evidence and its limitations and uncertainties, as well as on the appropriateness of revising the PM10 primary standard Considerations Retaining the current standard places a large amount of weight on the ISA conclusions that the evidence is only “suggestive”of a causal relationship We conclude that “suggestive” evidence is sufficient to justify retaining the current standard but not sufficient to justify revising that standard In contrast to CASAC, our rationale places relatively more weight on the “suggestive”nature of the overall body of evidence in interpreting specific studies CASAC placed more weight on specific studies than we judge to be appropriate Given the “suggestive” nature of the evidence, there is substantial uncertainty in the extent to which additionalpublic health benefits would result, beyond those provided by the current standard, if we set revised standard that targets protection to different areas
Secondary Standards: History of Visibility Standards • Over time, NAAQS and Regional Haze Programs have worked together • NAAQS: CAA requires “secondary standards which, in the judgment of the Administrator” are “requisite to protect the public welfare from any known or anticipated adverse effects (welfare effects explicitly include visibility) • 1971: Secondary PM NAAQS set to protect visibility at airports; distinct and more stringent than primary standard • 1987: Secondary NAAQS set identical to new primary PM10 standards; solicited comment on approaches to setting a distinct secondary standard • 1997: Secondary NAAQS set identical to new primary PM2.5 standards; intended to address urban visibility impairment in conjunction with Regional Haze Program • Regional Haze Program: • 1977: Congress established a national visibility goal to “remedy existing impairment and prevent future impairment” in Class I areas • 1990: Clean Air Act Amendments emphasized regional haze issues and directed EPA to establish Grand Canyon Visibility Transport Commission • 1999: Regional Haze Rule promulgated; specified use of an equation for calculating visibility impairment (in terms of light extinction) as a function of PM components and relative humidity
Secondary Standards: History of Visibility Standards (cont.) • 2006 NAAQS: Secondary standards set identical to revised primary PM2.5 standards • Not consistent with staff and CASAC advice to consider distinct sub-daily secondarystandard • CASAC expressed serious concerns with final decision; continuing to rely on primary standards to protect against welfare effects “assures neglect, and will allow substantial continued degradation, of visual air quality over large areas of the country” • Court remand: Decision to set secondary standards identical to primary standards was unreasonable and contrary to the law • EPA failed to identify a target level of protection, as required by CAA • EPA acknowledged that a PM2.5 mass-based standard, with a 24-hour averaging time, would not address regional differences in relative humidity, yet EPA did not address this issue at all in final decision
Secondary Standards: Key Visibility Science from the ISA • Public perception of haze depends on lighting and scene characteristics as well as on light extinction (i.e., fractional loss of light per unit distance) • Good visibility is important to public welfare • Air quality impacts on visibility negatively affect a person’s sense of personal comfort and wellbeing • For a given scene and lighting conditions, people consistently rate visibility levels and identify the amount of haze that is unacceptable when viewing photographs within a range of visibility conditions from pristine to highly impaired • ISA concluded there is a causal association between PM and light extinction • Particle light extinction efficiency depends on particle size and composition • There is no consistent relationship between PM2.5 mass concentration and light extinction • Determining PM2.5 light extinction • Directly measureby optical instrumentation, but no Federal Reference Method (FRM) currently available • Calculate using a simple equationfrom routinely available ambient PM2.5 mass concentration/composition and relative humidity data (as done for the Regional Haze Program)
Secondary Standards: Urban-Focused Visibility Assessment • Urbanvisibility preference survey studies conductedin four areas: Denver, CO; Vancouver, BC; Phoenix, AZ; and Washington, DC • Survey participants for each urban area consistently identified levels of unacceptable visibility • Results showed a range of values that divide visibility into acceptable and unacceptable conditions, results varied depending on characteristics of selected urban scene (using a “deciview” (dv) scale to characterize visibility) • Low end of the range – 20 dv (based on Denver study) • Middle of the range – 25 dv (based on Phoenix study) • High end of the range – 30 dv (based on Washington, DC study) • These values define three target protection levels used in subsequent assessments • Highest haze levels were observed for Eastern U.S. and California urban areas • Worst haze conditions were generally caused by sulfate, nitrate and carbonaceous PM2.5 • Assessed visibility impairment associated with just meeting the current PM2.5 standards for 14 urban areas • Target protection levels exceeded in most urban study areas • Resulted in substantially uneven visibility protection (i.e., significant over protection in West to get adequate protection in East) • Estimated improvements in visibility associated with alternative standards based on PM-related light extinction; resulted in uniform protection across all urban areas
Secondary Standards: Staff and CASAC Conclusions on Adequacy of Current Standards • In the Policy Assessment, staff concluded currently available information clearly calls into question the adequacy of the current suite of PM2.5 standards in the context of public welfare protection from visibility impairment, primarily in urban areas • Large percentage of days exceed target protection levels if all areas met the current suite of PM2.5 standards • Current averaging times (24-hours and annual) are not well-suited to protect against PM-related visibility impairment • Current averaging times include nighttime conditions, for which the science needed to support identification of appropriate levels of visibility protection is not well developed or understood • CASAC concurred, concluding that: “current secondary PM standards are inadequate to protect visibility, as their levels are too high, their averaging times are too long, and their (dried) mass-based indicators do not fully represent PM effects on visual air quality in the ambient atmosphere”
Secondary Standards: Staff and CASAC Conclusions on Alternative Standards Alternative indicators: • Directly measured PM2.5 light extinction – while strongly supported by CASAC for the future development of Federal Reference Method would take several years • Calculated PM2.5 light extinction – preferred alternative for this review -- build on existing monitoring network and calculate light extinction similar to Regional Haze Program Alternative averaging times: • In draft PA, staff concluded, and CASAC concurred, that 1-hour averaging timewas appropriate (limited to daylight hours with relative humidity less than 90%); also recognized that up to 4-hour averaging time may be appropriate • Final PA concludes that a 24-hour averaging timeis a reasonable and appropriate surrogate for light extinction calculated on a sub-daily basis • Based on recent analyses that identified data quality concerns with some hourly PM2.5 data • Also appropriate to consider a 4-hour averaging time to the extent that data quality issues can be appropriately addressed Level and form: • Final PA concludes that consideration should be given to the upper part of the range of levels presented in the draft PA, and supported by CASAC, especially in light of the limited nature of the information available from the public preference studies • Range from 28 – 25 dv, in conjunction with a 24-hour averaging time and 90th percentile form • Range from 30 – 25 dv, in conjunction with a 4-hour averaging time and 90th percentile form
Secondary Standards: Draft Proposal • With regard to current standards: • Propose that the existing PM2.5 standards are not adequately protective nor appropriate to address PM-related visibility impairment • Propose that a new standard is warranted to provide increased protection, primarily in urban areas, in conjunction with the Regional Haze Program, to achieve appropriate protection in areas across the country • With regard to a new standard to address PM-related visibility impairment (and respond to the court’s remand): • Propose a newstandard defined in terms of a PM2.5 visibility index with an averaging time of 24 hours, a 90th percentile form (averaged over 3 years), and a level of either 30 or 28 dv • Solicit comment on a range of levels down to 25 dv • Also solicit comment on alternative standards to address PM-related visibility impairment, including a sub-daily averaging time (e.g., 4 hours) and associated alternative levels in the range of 30 to 25 dv