Download
1 / 26
280 likes | 566 Vues
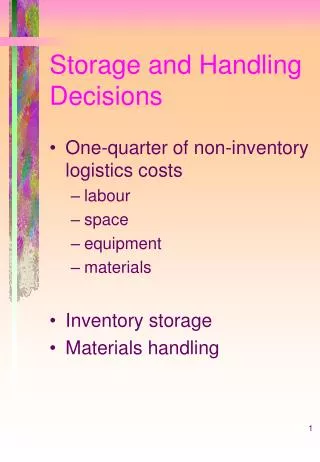
Storage and Handling Decisions. “Perfection is not attainable, but if we chase perfection, we catch excellence.” Vince Lombardi. Chapter 12. CR (2004) Prentice Hall, Inc. Inventory Strategy. Inventory Strategy. •. •. Forecasting.

E N D
Storage and Handling Decisions “Perfection is not attainable, but if we chase perfection, we catch excellence.” Vince Lombardi Chapter 12 CR (2004) Prentice Hall, Inc.
Inventory Strategy Inventory Strategy • • Forecasting Forecasting Transport Strategy Transport Strategy • • Inventory decisions Inventory decisions • • Transport fundamentals Transport fundamentals • • Purchasing and supply Purchasing and supply • • Transport decisions Transport decisions Customer Customer scheduling decisions scheduling decisions service goals service goals • • Storage fundamentals Storage fundamentals • • The product The product Storage decisions Storage/handling decisions • • ORGANIZING ORGANIZING • • Logistics service Logistics service PLANNING PLANNING CONTROLLING CONTROLLING • • Ord Ord . proc. & info. sys. . proc. & info. sys. Location Strategy Location Strategy • • Location decisions Location decisions • • The network planning process The network planning process Storage/Handling Decisions in Inventory Strategy CR (2004) Prentice Hall, Inc.
Site Selection Finds a specific real estate site as a storage · location Weighted checklist is a good approach. Recall, · Factor Marginal Factors Weights scores score 1 2 5 10 2 9 1 9 . . . . . . . . . . . . 12 4 8 32 Weighted score 286 Storage Decisions
Storage Decisions (Cont’d) CR (2004) Prentice Hall, Inc.
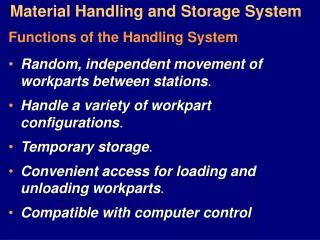
Rented space Space requirements, sq. ft. Privately- operated space Time Mixed Strategy for Warehouse Space Need for some space is seasonal 12-5 CR (2004) Prentice Hall, Inc.
Determination of a Mixed Warehouse Strategy for a 60,000 sq. ft. Privately-Operated Warehouse Private space exceeded CR (2004) Prentice Hall, Inc.
Storage Decisions (Cont’d) CR (2004) Prentice Hall, Inc.
Storage Decisions (Cont’d) CR (2004) Prentice Hall, Inc.
Facility Evaluation Suppose a pool point at St. Louis is being considered to lower transportation costs between manufacturer and its customers. Shipments currently are made directly from the manufacturer’s inventory in New York. There is a $10/cwt. handling charge at the pool point. Direct shipments CR (2004) Prentice Hall, Inc.
Facility Evaluation (Cont’d) Shipments through pool point Now, add handling cost of $10/cwt. 400 cwt. = $4,000 for a total cost of $15,472 + 4,000 = $19,472. Conclusion No benefit to using the pool point. CR (2004) Prentice Hall, Inc.
When is a Pool Point Likely to be an Advantage? • When shipment sizes are small • When demand is far from source points • When transportation rate economies are significant • When pool point operating costs are low relative to transportation costs • When transfer times are insignificant to service CR (2004) Prentice Hall, Inc.
Handling Decisions CR (2004) Prentice Hall, Inc.
Handling Decisions (Cont’d) CR (2004) Prentice Hall, Inc.
Handling Decisions (Cont’d) CR (2004) Prentice Hall, Inc.
Handling Decisions (Cont’d) · Cube - per - order index The cube-per-order index is the ratio of a product’s average required cubic footage for storage to the average number of daily orders on which the item is requested. The products with the lowest index value are located nearest the outbound dock. · Layout example By popularity - By cube - By CPO - CR (2004) Prentice Hall, Inc.
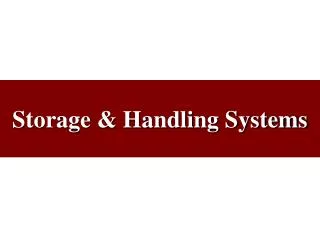
´ ( 1 ) ( 2 ) ( 3 ) ( 4 )=( 2 )/250 ( 6 )=( 5 )/( 4 ) ( 5 )=( 1 ) ( 3 ) Average Required Item Expected Average Number Cube - Storage Size, Number of Inventory, of Daily Per - Order Space, a Product cu. ft. Orders/Yr. Units Orders Index cu. ft. A 6.0 6,750 800 27 4,800 177.8 B 4.0 15,750 16,000 63 64,000 1015.9 C 1.0 11,250 25,120 45 25,120 558.2 D 8.0 25,500 18,600 102 148,800 1458.8 E 3.0 17,750 12,533 71 37,599 529.6 F 5.0 3,500 3,936 14 19,680 1405.7 G 15.0 6,250 907 25 13,605 544.2 Totals 86,750 77,896 313,604 a Based on 250 selling days per year Product Layout Example By cube Basic data By CPO By popularity 12-16 CR (2004) Prentice Hall, Inc.
Inbound rail dock D D D F,D C,B B,F A,E E,G,C Layout by CPO Highest index values Lowest index values Outbound truck dock
Layout by Activity Profiling Data mine orders to determine activity distributions. Layout warehouse space according to activity levels. A high-throughput warehouse layout for drug store replenishment
Handling Decisions (Cont’d) • Order handling for increased handling efficiency • Product sequencing on picker list • Picker zoning and the “bucket brigade” • Order splitting • Multiple order picking per picking pass Stock Arrangement • On-the-square layout • Angular pallet placement CR (2004) Prentice Hall, Inc.
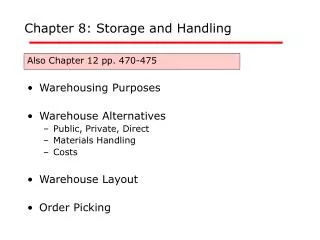
Storage bay Center line of aisle (b)Angular pallet placement Storage bay Top-down view of storage bays Center line of aisle Pallet Layout in Warehouses (a) On-the-square pallet placement
Stock Arrangement On-the-square pallet layout · Angular pallet layout · Stock locator-identification methods Fixed locator-identification method · Random locator-identification method · Zone location · Handling Decisions (Cont’d) Increases cube utilization CR (2004) Prentice Hall, Inc.
Equipment Selection One-time purchase of equipment of different types can be decided on basis of present value analysis, or by selecting the alternative with the lowest NPV. where NPV = net present value of equipment over its useful life ($) I = initial investment ($) C = annual operating cost ($) i = the discount, or hurdle, rate that such investments are expected to return Sn = salvage value in year n ($) n = useful life of the equipment (years) CR (2004) Prentice Hall, Inc.
Equipment Selection (Cont’d) ProblemTwo type A forklift trucks can do the same work as three type B trucks. Additional data are: CR (2004) Prentice Hall, Inc.
Equipment Selection (Cont’d) Solution Solve the NPV equation for the two alternatives. For truck type A, For truck type B, Choose two type A trucks CR (2004) Prentice Hall, Inc.
Equipment Replacement • A financial problem • Alternatives are compared through present value analysis • Typical design concerns differing degrees of automation, capacity, and equipment life. Example A forklift truck that costs $3,000 and requires $200 to operate in its first year, but operating costs increase at the rate of $30 per year squared thereafter. Technological improvement reduces operating costs by $20 per year. The normal life of a truck is 10 years and the truck can be sold for its remaining undepreciated value. A discount rate of 20%/yr. is used. When should the truck be replaced? We calculate the equivalent annual cost according to
(1) (2) (3) (4) (5) (6) (7)= (1+3-5)(6) Discounted Discounted Equivalent Replace- Operating Salvage Discount Average ment Initial Total Costs, Salvage Value, Factor, Annual C S + n n 1 i ( i ) Cycle Invest- Operating Value, Cost, å j n + - + j n 1 1 1 ( i ) ( i ) + Time, n ment, I Costs, C S AC n ( 1 i ) j n n = j 1 a b 1 $3,000 $200 $167 $2,700 $2,250 1.20 $1,100 2 3,000 410 312 2,400 1,668 0.65 1,068 3 3,000 690 475 2,100 1,215 0.47 1,062 4 3,000 1,100 672 1,800 868 0.39 1,094 5 3,000 1,700 913 1,500 603 0.33 1,092 6 3,000 2,550 1,198 1,200 402 0.30 1,138 7 3,000 3,710 1,522 900 251 0.28 1,196 8 3,000 5,240 1,878 600 140 0.26 1,232 9 3,000 7,200 2,258 300 58 0.25 1,300 10 3,000 9,650 2,653 0 0 0.24 1,357 Replacement Example aComputed as Cj =200 - 20(j-1) + 30(j-1)2 and accumulated when there is more than one year in the replacement cycle bComputed as Sn = I[1-0.1(n)] Accumulates costs for years 1 and 2 12-26 CR (2004) Prentice Hall, Inc.