Download
1 / 22
220 likes | 370 Vues
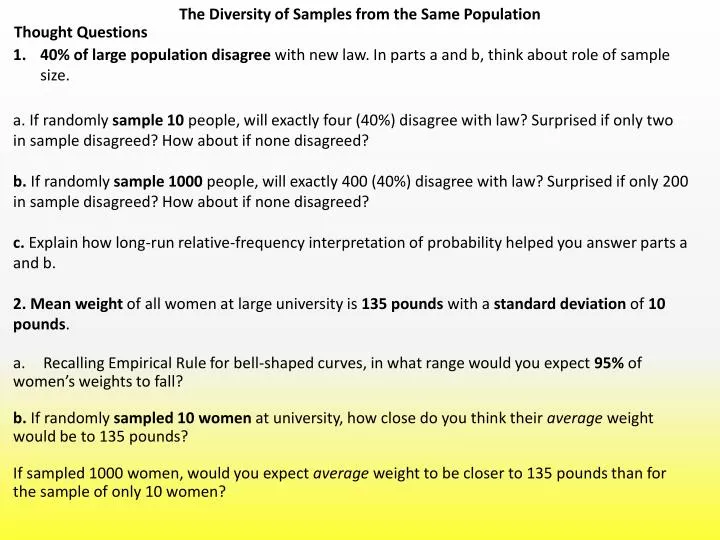
The Diversity of Samples from the Same Population. Thought Questions. 40% of large population disagree with new law. In parts a and b, think about role of sample size. a. If randomly sample 10 people, will exactly four (40%) disagree with law? Surprised if only two

E N D
The Diversity of Samples from the Same Population Thought Questions • 40% of large population disagree with new law. In parts a and b, think about role of sample size. • a. If randomly sample 10 people, will exactly four (40%) disagree with law? Surprised if only two • in sample disagreed? How about if none disagreed? • b. If randomly sample 1000 people, will exactly 400 (40%) disagree with law? Surprised if only 200 • in sample disagreed? How about if none disagreed? • c. Explain how long-run relative-frequency interpretation of probability helped you answer parts a • and b. • 2. Mean weight of all women at large university is 135 pounds with a standard deviation of 10 • pounds. • Recalling Empirical Rule for bell-shaped curves, in what range would you expect 95% of • women’s weights to fall? • b. If randomly sampled 10 women at university, how close do you think their average weight • would be to 135 pounds? • If sampled 1000 women, would you expect average weight to be closer to 135 pounds than for • the sample of only 10 women?
The Diversity of Samples from the Same Population Setting the Stage • Working Backward from Samples to Populations • Start with question about population. • Collect a sample from the population, measure variable. • Answer question of interest for sample. • With statistics, determine how close such an answer, based on a sample, would tend to be • from the actual answer for the population. • Understanding Dissimilarity among Samples We need to understand what kind of differences we should expect to see in various samples from the same population
The Diversity of Samples from the Same Population What to Expect of Sample Means • Want to estimate average weight loss for all who attend national weight-loss clinic for 10 weeks. • Unknown to us, population mean weight loss is 8 pounds and standard deviation is 5 pounds. • If weight losses are approximately bell-shaped, 95% of individual weight losses will fall between –2 (a gain of 2 pounds) and 18 pounds lost. Possible Samples (random samples of 25 people from this population) Sample 1: 1,1,2,3,4,4,4,5,6,7,7,7,8,8,9,9,11,11,13,13,14,14,15,16,16 Sample 2: –2, 2,0,0,3,4,4,4,5,5,6,6,8,8,9,9,9,9,9,10,11,12,13,13,16 Sample 3: –4,–4,2,3,4,5,7,8,8,9,9,9,9,9,10,10,11,11,11,12,12,13,14,16,18 Sample 4: –3,–3,–2,0,1,2,2,4,4,5,7,7,9,9,10,10,10,11,11,12,12,14,14,14,19 Results: Sample 1: Mean = 8.32 pounds standard deviation= 4.74 pounds Sample 2: Mean = 6.76 pounds standard deviation = 4.73 pounds Sample 3: Mean = 8.48 pounds standard deviation = 5.27 pounds Sample 4: Mean = 7.16 pounds standard deviation = 5.93 pounds Each sample gave a different sample mean, but close to 8.
The Diversity of Samples from the Same Population Conditions for Rule for Sample Means 1. Population of measurements is bell-shaped, and a random sample of any size is measured. Population mean is equal to 100
The Diversity of Samples from the Same Population Population Mean = 100. Histograms of sample means from repeated sample of the same size
The Diversity of Samples from the Same Population 2. Population of measurements of interest is not bell-shaped, but a largerandom sample is measured. Sample of size 30 is considered “large,” but if there are extreme outliers, better to have a larger sample. Population Mean is 21.76
The Diversity of Samples from the Same Population Population Mean = 21.76. Histograms of sample means from repeated sample of the same size
The Diversity of Samples from the Same Population If numerous samples or repetitions of the same size are taken, the frequency curve of means from various samples will be approximately bell-shaped. The mean for the sampling distribution of the sample mean is equal to the true population mean The standard deviation(SD) for the sampling distribution of the sample mean is population standard deviation sample size
The Diversity of Samples from the Same Population Normal quantile (probability) plots • One way to assess if a distribution is indeed approximately normal is to plot the data on a normal quantile plot. • Arrange the observed data from smallest to largest. Record what percentile of the data each value occupies. For example, the smallest observation in a set of 20 is at the 5% point, the second smallest at the 10% point. • 2. Do Normal distribution calculations to find the values of z-scores corresponding to these same percentiles. For example, z = -1.645 is the 5% point of the standard Normal distribution, and z = -1.282 is the 10% point. • Plot each data point x against the corresponding Normal score. If the data distribution is close to a Normal distribution, the plotted points will lie close to a straight line. • Systematic deviations from a straight line indicate a non-normal distribution. Outliers appear as points that are far away from the overall pattern of the plot.
The Diversity of Samples from the Same Population Normal quantile (probability) plots Good fit to a straight line: the distribution of rainwater pH values is close to normal. Curved pattern: the data are not normally distributed. Instead, it shows a right skew: a few individuals have particularly long survival times.
The Diversity of Samples from the Same Population Conditions for Rule for Sample Means 1. Population of measurements is bell-shaped, and a random sample of any size is measured. OR 2. Population of measurements of interest is not bell-shaped, but a largerandom sample is measured. Sample of size 40 is considered “large,” but if there are extreme outliers, better to have a larger sample. Text Questions 15. Explain whether you think the Rule for Sample Means applies to each of the following situations. If it does apply, specify the population of interest and the measurement of interest. If it does not apply, explain why not. b. A large corporation would like to know the average income of the spousesof its workers. Rather than go to the trouble to collect a random sample, they post someone at the exit of the building at 5 P.M. Everyone who leaves between 5 P.M. and 5:30 P.M. is asked to complete a short questionnaire on the issue; there are 70 responses. c. A university wants to know the average income of its alumni. Staff members select a random sample of 200 alumni and mail them a questionnaire. They follow up with a phone call to those who do not respond within 30 days. 8. Suppose the population of IQ scores in the town or city where you live is bell shaped, with a mean of 105 and a standard deviation of 15. Describe the frequency curve for possible sample means that would result from random samples of 100 IQ scores.
The Diversity of Samples from the Same Population Example : Using Rule for Sample Means Weight-loss example, population mean and standard deviation were 8 pounds and 5 pounds, respectively, and we were taking random samples of size 25. Potential sample means represented by a bell-shaped curve with mean of 8 pounds and standard deviation: 5 = 1 pound 25 For our sample of 25 people: • 68% of sample means will be between7 and 9 pounds • 95% of sample means will be between 6 and 10 pounds • 99.7% of sample means will be between 5 and 11 pounds Increasing the Size of the Sample Weight-loss example: suppose a sample of 100 people instead of 25 was taken. Potential sample means still represented by a bell-shaped curve with mean of 8 pounds but standard deviation: 5 = 0.5 pounds 100 For our sample of 100 people: • 68% of sample means will be between7.5 and 8.5 pounds • 95% of sample means will be between7 and 9 pounds • 99.7% of sample means will be between 6.5 and 9.5 pounds
The Diversity of Samples from the Same Population What to Expect of Sample Proportions A slice of the population: 40% of population carry a certain gene Do Not Carry Gene = , Do Carry Gene = X Possible Samples Sample 1: Proportion with gene = 12/25 = 0.48 = 48% Sample 2: Proportion with gene = 9/25 = 0.36 = 36% Sample 3: Proportion with gene = 10/25 = 0.40 = 40% Sample 4: Proportion with gene = 7/25 = 0.28 = 28%
The Diversity of Samples from the Same Population Conditions for Rule for Sample Proportions • Thereexists an actual population with fixed proportion who have a certain trait. • Random sample selected from population (so probability of observing the trait is same for each sample unit). • Size of sample or number of repetitions is relatively large • (sample size) x (true proportion) and (sample size) x (1 – true proportion) must be greater that or equal to 5 Defining the Rule for Sample Proportions If numerous samples or repetitions of the same size are taken, the frequency curve made from proportions from various samples will be approximately bell-shaped. In other words, the sampling distribution model of the sample proportion is Normal and centered at the true population proportion, with standard deviation (true proportion)(1 – true proportion) sample size
The Diversity of Samples from the Same Population (0.40)(1 – 0.40)= 0.01 2400 Example : Suppose 40% of all voters in U.S. favor candidate X. Pollsters take a sample of 2400 people. What sample proportion would be expected to favor candidate X? The sample proportion could be anything from a bell-shaped curve with mean 0.40 and standard deviation: For our sample of 2400 people: • 68% of sample proportions will be between 39% and 41% • 95% of sample proportions will be between 38% and 42% • 99.7% of sample proportions will be between 37% and 43% Text Question 2. Suppose the truth is that .12 or 12% of students are left-handed, and you take a random sample of 200 students. Use the Rule for Sample Proportions to draw a picture showing the possible sample proportions for this situation.
The Diversity of Samples from the Same Population 1000 Simulated Samples (n=30)
The Diversity of Samples from the Same Population approximately 95% of sample proportions fall in this interval. Is it likely we would observe a sample proportion 0.30? 1000 Simulated Samples (n=30)
The Diversity of Samples from the Same Population 1000 Simulated Samples (n=66)
The Diversity of Samples from the Same Population approximately 95% of sample proportions fall in this interval (0.062 to 0.238). Is it likely we would observe a sample proportion 0.30? 1000 Simulated Samples (n=66)
The Diversity of Samples from the Same Population Do Americans Really Vote When They Say They Do? • Reported in Time magazine (Nov 28, 1994): • Telephone poll of 800 adults (2 days after election) – 56% reported they had voted. • Committee for Study of American Electorate stated only 39% of American adults had voted. • Could it be the results of poll simply reflected a sample that, by chance, voted with greater • frequency than general population? • Suppose only 39% of American adults voted. We can expect sample proportions to be • represented by a bell-shaped curve with mean 0.39 and standard deviation: (0.39)(1 – 0.39)= 0.017 or 1.7% 800 • 68% of sample proportions will be between 37.3% and 40.7% • 95% of sample proportions will be between 35.6% and 42.4% • 99.7% ofsample proportions will be between 33.9% and 44.1%
The Diversity of Samples from the Same Population Example: Alzheimer’s in US
The Diversity of Samples from the Same Population Text Questions • 4. A recent Gallup Poll found that of 800 randomly selected drivers surveyed, 70% thought they were better-than-average drivers. In truth, in the population, only 50% of all drivers can be "better than average.“ • Draw a picture of the possible sample proportions that would result from samples of 800 people from a population with a true proportion of .50. • b. Would we be unlikely to see a sample proportion of .70, based on a sample of 800 people, from a population with a proportion of .50? Explain, using your picture from part a.