Download
1 / 35
350 likes | 376 Vues
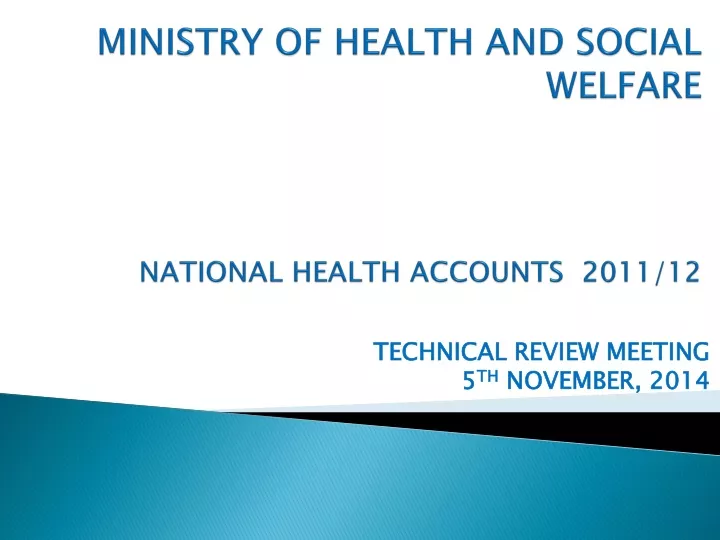
MINISTRY OF HEALTH AND SOCIAL WELFARE NATIONAL HEALTH ACCOUNTS 2011/12. TECHNICAL REVIEW MEETING 5 TH NOVEMBER, 2014. Outline. NHA and PER Concept Overview History of NHA Usefulness of NHA Institutionalization Process Methodology Overall findings Challenges and Way Forward.

E N D
MINISTRY OF HEALTH AND SOCIAL WELFARENATIONAL HEALTH ACCOUNTS 2011/12 TECHNICAL REVIEW MEETING 5TH NOVEMBER, 2014
Outline • NHA and PER Concept Overview • History of NHA • Usefulness of NHA • Institutionalization Process • Methodology • Overall findings • Challenges and Way Forward
NHA Concept Overview • Statistical system of accounts • Describes the totality of expenditure flows • Describes the sources of all funds utilized in the health sector • Describes uses of these funds
PER Concept Overview • PER • Expenditure flow on the public funds • Funding through Exchequer system • Donor funding through Government systems are regarded public funds • Focuses on the current pertinent issues
History of NHA in Tanzania • Four NHA studies since 2001 • First NHA estimates were for 1999/00 and focused on general NHA • The second (2002/03, 2005/06) and third NHAs (2009/10) • included subaccounts on HIV/AIDS, Malaria, TB, Reproductive Health, and Child Health • The 2011/12 NHA covers more diseases
NHA usefulness • Monitoring of trends over time • International comparisons • Financing gap • Sustainability • Comprehensive and consistent view of health spending
Methodology – NHA 11/2012 • Institutional Survey • Donors – response rate 47% • NGOs – response rate 53% • Programme (NACP, NMCP, TBLP, TACAIDS) • Secondary information • MoHSW,Local Government Authorities,Regional Authorities (Financial reports, Epicor and MTEF) • Estimates for: Parastatals (40) Private firms (56) and Insurance (8) • HH data from National Panel Survey (NPS) , • Economic survey-inflation and GDP • HMIS for utilization by level of facilities
General Findings • Total Health Expenditure (THE) has increased from TZS 2,323 billion in 2009/10 to TZS 3,364 billion in 2011/12 • Government Health Expenditure (GHE) has remained at the average of 7% of Total Government Expenditure • Per capita spending has increased from TZS 54,529 in 2009/10 to TZS 71,428 in 2011/12 • Donors are the main financiers of health sector, at 48% of THE • GHE has remained at 21% of THE • Out of pocket has decreased from 32% to 27%
Total Health Expenditure by Financing Source, 2002/03 - 2011/12 • Donors remain the main financiers of THE, contributing an increased share of 48% in 2011/12 • Households still contribute significantly (27%) though the share is falling • Public sector financing continues to fall slightly, reaching 21% in 2011/12 • The share of other private sector(companies) remain negligible, at 4%
THE by Financing Agent, 2002/03 – 2011/12 • MOHSW managed 16% of THE in 2011/12, a small but steady decline • Local Government Authorities managed a slightly increasing share, at 17% in 2011/12 • Households role declined to 25% in 2011/12 • NGOs managed 22 percent of THE in 2011/12
Spending by disease in 2011/12 • HIV/AIDS, TB and malaria together account for 45% of THE, while Reproductive and Child Health accounts for 12%
THE by provider, 2002/03 - 2011/12 • Hospitals account for 29% of THE in 2011/12, a reduction on the 2009/10 share • The share of lower level facilities rose slightly to 28% • Preventive care provision fell to 17% and the share of health administration rose to 13%
THE by factors of provision, 2011/12 Pharmaceuticals accounts for large part which is 26 percent in 2011/12
Policy issues raised • Donor dependency is high and appears to be increasing, with DPs providing 48% of the budget • > concerns re sustainability • Out of pocket payments are still high • > need to establish effective pre payment schemes in context of overall HFS • Role of NGOs in managing sector resources is significant • All stakeholders should work establish mechanism for improved monitoring of the operations and impact
Policy issues (2) • Almost half the funds are spent on Malaria, Tuberculosis and HIV/AIDS • We need to ensure that there is a balance in distribution of resources across diseases • Increase focus on non-communicable
Challenges • Low response rate (Donors, NGOs, Insurance Companies) • Data inconsistency, from various sources • Timeframe • Format • Scope
Way forward • Finalize the NHA 2011/12 • Disseminate the findings • Continue with the preparation of NHA 2013/14 • Institutionalization of NHA preparation
Public Expenditure Review – PER 2013-14 Update 05th November 2014
INTRODUCTION • Objectives • Trend in Health Sector Funding • Implementation of Fiscal Decentralization • Implementation of the Prepayment Scheme Financing • Further analysis on main expenditure drivers
Regional CHF coverage, 2013/14 Source: NHIF data
Conclusion • Health Sector share of Government expenditure slightly increased • Percapita has increased in budget and actual expenditures both in real and nominal terms • Slight increase on the prepayment schemes coverage
Way forward • Clarification of remaining queries with MOF (end Nov) • Analysis of LGA spending in FY 2013/14 (end Nov) • Finalise sub-analyses: (end Nov) • PE : OC • Medicines • Budget execution • Cost-sharing
Way forward • Complete first draft report (end Dec) • Present and circulate final draft to SWAp meeting (end Jan 2015) • Incorporate revisions (mid-Jan) • Discussions with MOF re harmonisation of definitions of the sector for future analyses (PER, NHA, RBA etc)
Asanteni End