Download
1 / 16
160 likes | 270 Vues
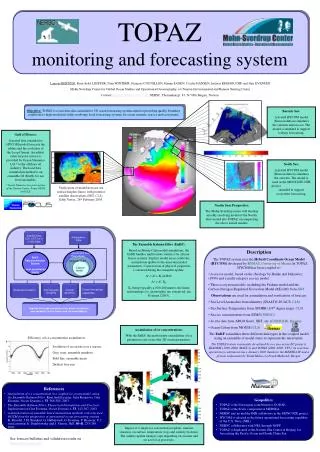
Integrated modelling and monitoring for use in forecasting Jørgen Brandt and Finn Palmgren National Environmental Research Institute Department of Atmospheric Environment Denmark. Integrated modelling and monitoring strategy.

E N D
Integrated modelling and monitoring for use in forecasting Jørgen Brandt and Finn Palmgren National Environmental Research Institute Department of Atmospheric Environment Denmark
Integrated modelling and monitoring strategy During the last decades, there has been a strong integration between atmospheric monitoring and modelling at NERI with focus on human exposure, human health, marine and terrestrial ecosystems, process understanding, etc. The modelling and the monitoring have been closely designed to supplement each other for optimal application at the different scales: urban street canyons, urban background, near city background, rural background and remote The model results at all scales has been fully implemented in the general monitoring of air quality in Denmark The monitoring data have been used for the general model development strategy (e.g. defining the problems to be modelled), validation, estimation of emission factors, etc.
Permanent monitoring stations for “standard pollutants” located in the typical environments: streets, urban background, “near city” background, rural background and remote. Measurement campaigns of more advanced measurements established at the permanent monitoring sites. Application of air quality models and receptor models for data analysis. Application of air quality models for nowcast and forecast, e.g. for information to the public. Integrated monitoring strategy
256 m Measurements at elevated sites • Long range transport of air pollutants is important in Scandinavia • Measurements at ground level are influenced by local sources and deposition • The combination of measurements at ground level and at 260 m to be used for development and validation of regional models
Monitoring stations in Copenhagen HCØ (urban background) Jagtvej (street) HCAB (street)
The THOR Integrated Model System (http://thor.dmu.dk) Global met. data from NCEP/ECMWF Climate model results/scenarios Monitoring dataField experiments Real-timemeasurementsSatellite data Data assimilation NWF model (Eta/MM5) Emission and traffic models Global/hemispheric modelDEHM Accidental release model (DREAM) Emission and traffic scenarios Long range transport model (DEHM-REGINA) ~3000 visualizations and animations of weather and air pollution, four times a day Decision makers National range model(DEHM-DK) Subset to decision makers, web site, radio, TV, newspapers, the public, etc. Human exposureHuman healthMarine models, Terrestrial models,Socioeconomic models Urban background model (UBM) and point source model (OML) Street canyon model (OSPM) AirGis
Long-range transport of tropospheric air pollution in the Northern Hemisphere and Europe 60 chemical species Full three dimensional advection/diffusion equations Two-way nested modelling over Europe and northern Europe (3 domains) 150 / 50 / 16.67 km grid resolution 20 vertical levels up to 16 km Model run and validation for a period of 16 years (1989 to 2004) Meteorological driver; MM5 nested over Europe or Eta (Europe) The Danish Eulerian Hemispheric Model, DEHM NO2 O3
Gaussian plume model (horizontal) and linear dispersion to Hmix (vertical) Input data: - Meteorological forecast from the Eta model - Air pollution forecast from DEHM - Emissions of NOx, CO, benzene and PM10 Output: hourly values of O3, NO, NO2 , NOx , CO, benzene and PM10 Resolution ~ 500 m - 2 km Validated for e.g. Copenhagen and Aalborg (Denmark), Has been tested as part of CityDelta, including eight cities in Europe Background Urban Model, BUM NOx emissions [kg/day] NO2 conc. g/m3
Street canyon model Combined plume model (leeward side of the street) and box model (windward side) Input: - Meteorological forecast from the Eta model - Air pollution forecast from DEHM and the Urban Background Model, BUM - Street configuration - traffic data Output: O3, NO, NO2, NOx, CO, benzene and PM10 Forecasts at both sides of the street Used and validated for e.g. Copenhagen and Aalborg and many other places NO + O3 NO2 NO2 + hv O3 + NO Operational Street Pollution Model, OSPM
Air quality forecast for the cities of Copenhagen and Aalborg + local radio, TV and newspapers
Time series of concentrations at Aalborg roof level (left) and concentrations (right) at Aalborg street level
By integrating modelling and monitoring at all scales and typical environments, we gain a better understanding of the governing processes, better models and better monitoring programmes. Since 1998 we have operationally produced three-days air quality forecasts at the different scales: European/regional, urban background and urban street. Ongoing developments include models with even higher resolution (1 km x 1 km at national scale) and implementation of data assimilation techniques. Conclusions and future work
We are right now in the process of implementing different data assimilation techniques in the models 4D-Var and Optimum Interpolation for regional models Kalman filtering for urban models Data assimilation will, of course, be important for the air quality forecasts at all scales However, the technique will also be applied in connection with the monitoring programmes to make better estimates of e.g. human exposure or deposition of nitrogen to ecosystems, etc., in all areas where measurements are not carried out. Data assimilation
NCEP kindly provides global meteorological forecast data EMEP kindly provides air pollution measurement data and emission data Acknowledgements
THOR system (description of the system): http://thor.dmu.dk THOR system (demo): http://www.dmu.dk/AtmosphericEnvironment/thor/index.html Operational Air Forecast, actual air quality data, etc.: http://luft.dmu.dk City of Copenhagen: http://www.miljoe.kk.dk/luftudsigt City of Aalborg: http://www.aalborg-trafikinfo.dk or e-mail: jbr@dmu.dk or fpj@dmu.dk Further information