Download
1 / 21
210 likes | 438 Vues
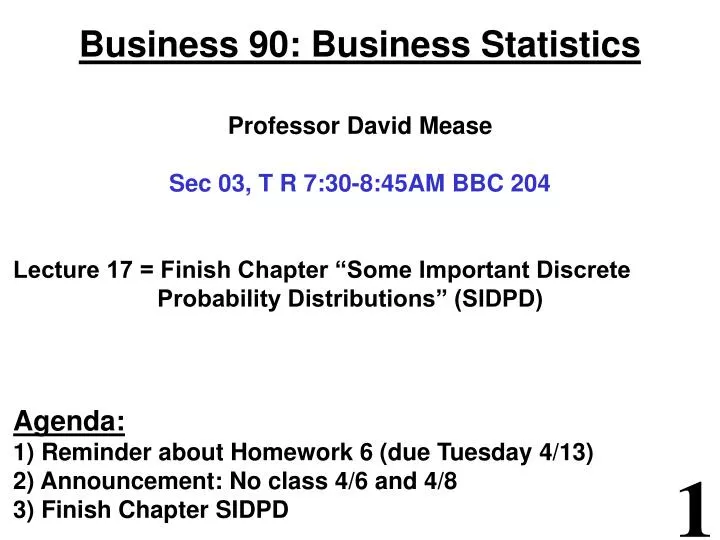
Business 90: Business Statistics Professor David Mease Sec 0 3 , T R 7 : 3 0- 8 : 4 5AM BBC 204 Lecture 17 = Finish Chapter “Some Important Discrete Probability Distributions” (SIDPD) Agenda: 1) Reminder about Homework 6 (due Tuesday 4/13) 2) Announcement: No class 4/6 and 4/8

E N D
Business 90: Business Statistics Professor David Mease Sec 03, T R7:30-8:45AM BBC 204 Lecture 17 = Finish Chapter “Some Important Discrete Probability Distributions” (SIDPD) Agenda: 1) Reminder about Homework 6 (due Tuesday 4/13) 2) Announcement: No class 4/6 and 4/8 3) Finish Chapter SIDPD
Homework 6 – Due Tuesday 4/13 1) Read chapter entitled “Some Important Discrete Probability Distributions” but only sections 1-3. 2) In that chapter do textbook problems 3, 4, 14, 15 and 20 (but skip part g in 20) 3) Stock X has a mean of $50 and a standard deviation of $10. Stock Y has a mean of $100 and a standard deviation of $20. Find the mean and standard deviation of buying one share of each A) If they are independent (so the covariance is 0) B) If the covariance is 30 C) If the covariance is -30
Announcement: There will be no class Tuesday 4/6 and Thursday 4/8. There will also not be any office hours Thursday 4/8. The next class after Spring Break is Tuesday 4/13 which is when Homework 6 is due.
Statistics for Managers Using Microsoft® Excel4th Edition Some Important Discrete Probability Distributions
Chapter Goals After completing this chapter, you should be able to: • Compute and interpret the mean and standard deviation for a discrete probability distribution • Explain covariance and its application in finance • Use the binomial probability distribution to find probabilities • Describe when to apply the binomial distribution
Introduction to Probability Distributions • Random Variable • Represents a possible numerical value from an uncertain event Random Variables Discrete Random Variable Continuous Random Variable (This Chapter) (Next Chapter)
Discrete Probability Distributions A discrete probability distribution is given by a table listing all possible values for the random variable along with the corresponding probabilities. The appropriate chart to display it is a bar chart (which has gaps, unlike a histogram).
Discrete Random Variable Summary Measures • Expected Value (or mean) of a discrete distribution (Weighted Average)
Discrete Random Variable Summary Measures (continued) Variance of a discrete random variable Standard Deviation of a discrete random variable where: E(X) = Expected value of the discrete random variable X Xi = the ith outcome of X P(Xi) = Probability of the ith occurrence of X
In class exercise #70: A Bay Area software company is trying to hire as many qualified job candidates as possible. Next Monday they will interview 4 candidates. The probability of each candidate being hired is 20% and the hiring decisions are independent. a) Give the probability distribution for the number of candidates they will hire next Monday. Also, for the number of candidates they will hire next Monday compute b) the mean c) the variance d) the standard deviation
Binomial Probability Distribution • A fixed number of observations, n • e.g., 15 tosses of a coin; ten light bulbs taken from a warehouse • Two mutually exclusive and collectively exhaustive categories • e.g., head or tail in each toss of a coin; defective or not defective light bulb • Generally called “success” and “failure” • Probability of success is p, probability of failure is 1 – p • Constant probability for each observation • e.g., Probability of getting a tail is the same each time we toss the coin • Observations are independent • The outcome of one observation does not affect the outcome of the other
Examples of Binomial Distribution Settings • A manufacturing plant labels items as either defective or acceptable • A firm bidding for contracts will either get a contract or not • A marketing research firm receives survey responses of “yes I will buy” or “no I will not” • New job applicants either accept the offer or reject it
Binomial Distribution Formulas n ! - X X n P(X) = p (1-p) X! ( - ) ! n X P(X) = probability of X successes in n trials, with probability of success p on each trial X = number of ‘successes’ in sample, (X = 0, 1, 2, ..., n) n = sample size (number of trials or observations) p = probability of “success” Mean Variance and Standard Deviation
In class exercise #71: Redo ICE # 70 using the binomial formulas.
Using Binomial Tables (like Table 6 in back of book) Examples: n = 10, p = .35, x = 3: P(x = 3) = .2522 n = 10, p = .75, x = 2: P(x = 2) = .0004
In class exercise #72: Check your probabilities for ICE #70 using Table 6 in the back of the book.
In class exercise #72: Check your probabilities for ICE #70 using Table 6 in the back of the book.
In class exercise #73: An important part of the customer service responsibilities of a telephone company relates to the speed with which customer service troubles can be repaired. Suppose past data indicate that the likelihood is 0.70 that troubles in residential service can be repaired on the same day. For the first five troubles reported on a given day, what is the probability that a) all five will be repaired on the same day? b) at least three will be repaired on the same day?
In class exercise #74: If I shoot three point baskets with 68% accuracy, what is the probability I make exactly 7 out of 10?
Using Excel to get Binomial Probabilities Example: n = 10, p = .68, x = 7: then Excel tells us P(7) = .2644