Download
1 / 30
300 likes | 415 Vues
Rio de Janeiro Earth Summit Signatories pledged to establish a system of protected areas Reserves should be Comprehensive Representative Adequate Flexible and Efficient consider Irreplaceability Shape Connectivity Risk spreading. RESERVE DESIGN. The Goal:

E N D
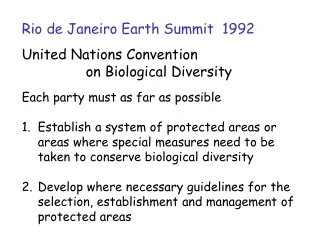
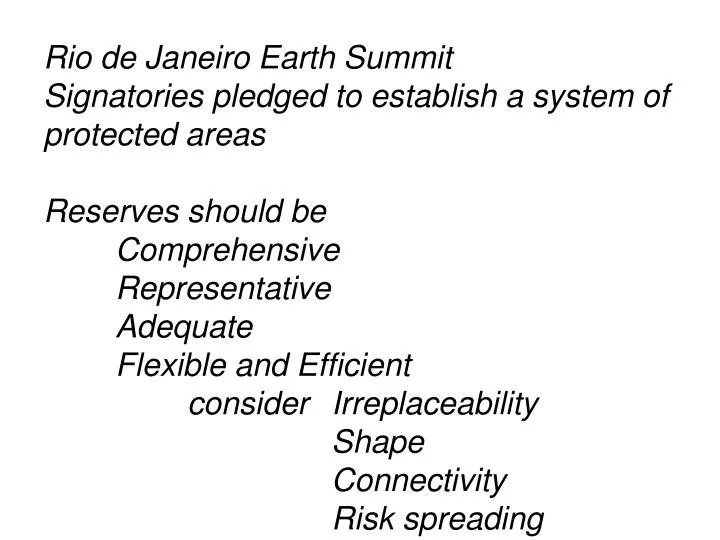
Rio de Janeiro Earth Summit Signatories pledged to establish a system of protected areas Reserves should be Comprehensive Representative Adequate Flexible and Efficient consider Irreplaceability Shape Connectivity Risk spreading
RESERVE DESIGN The Goal: A reserve system that includes and sustains all biodiversity and ecosystem processes of the region HOW?
CHOOSING A SURROGATE FOR BIODiVERISTY HOW STAGES IN SYSTEMATIC CONSERVATION PLANNING • Compile data on biodiversity • Identify conservation goals 3. Review existing conservation areas 4. Select additional areas • Implement conservation actions • Maintain the required values of selected areas Margules and Pressey 2000
Designing a reserve system MINIMAL SET- minimize the resources expended while meeting all conservation objectives ---> efficient baseline reserve system for minimal cost MAXIMAL COVERAGE - maximise the level of representation for each feature given a fixed amount of resources ---> system with best bang for the buck
Designing a reserve system • Mathematical algorithms are used to solve the minimal set or maximal coverage problem • iterative process that selects best site at any given step given a set of explicit rules • Greedy algorithm • Select site that adds most unprotected spp • Rarity algorithm • Select sites that represent rare species first • Select site that adds most unprotected spp
Designing a reserve system Common Approach with Large Datasets Simulated annealing Start with random reserve system Add/remove one site Evaluate change to system +ve/-ve Initially accept good and bad changes Gradually reduce chance accepting a bad change Eventually only accept good changes ---> reliable and flexible decision making
What features can be used as surrogates for overall biodiversity? • Flagship Species • charismatic species • Umbrella Species • Species requiring massive areas • Biodiversity Indicators - • Sets of spp that indicate areas of high species richness • Land types - • land systems or vegetation classes
Flagship and Umbrella Species
Evaluating Flagship and Umbrella Species Columbia Plateau - 1241 sites 211 species 9 charismatic species
Evaluating Flagship and Umbrella Species Columbia Plateau - 1241 sites 211 species 9 charismatic spp --> protect all sites where found % spp protected 50% % sites required 40% 10 random spp % spp protected 40% % sites required 12% Umbrellas and flagships are expensive
Evaluating Flagship and Umbrella Species Columbia plateau - 1241 sites 211 species Spp protected Sites required Percentage Number of times each charismatic spp represented Umbrellas and flagships are not representative Andelman and Fagan 2000 PNAS 97: 5954-5959
Evaluating biodiversity indicators Are hotspots for one taxa hotspots for all taxa? Do hotspots help protect rare species? DATA - UK - birds butterflies dragonflies - liverworts and aquatic plants Prendergast et al. 1993 Nature 365: 335-7
Evaluating biodiversity indicators Are hotspots for one taxa hotspots for all taxa? NO Prendergast et al. 1993 Nature 365: 335-7
Evaluating biodiversity indicators Do hotspots help protect rare species? 10x10 km squares Rare butterflies NO - 25% or more of rare species are not found in hotspots
Evaluating biodiversity indicators Uganda - 15,000 km2 of forest reserve - 3,000 km2 slated to be strict reserve
Evaluating biodiversity indicators Uganda - 15,000 km2 of forest reserve - 3,000 km2 slated to be strict reserve Data - 5 yr inventory of 50 forests - woody plants, large moths, butterflies birds and small mammals - 2452 spp Does spp richness of one taxa predict others? Q. How would you test this?
Evaluating biodiversity indicators Correlations Correlations after controlling for forest size and sampling effort Spp richness of one taxa does not predict overall biodiversity very well Howard et al 1998 Nature 394: 472-5
Evaluating biodiversity indicators But reserves selected based on birds or butterflies are as good as reserves based on all taxa
Evaluating biodiversity indicators South Africa - Transvaal Data - 25x25km grid squares (n=474) - mammals, birds, butterflies - vascular plants - termites, ant-lions, beetles Selected minimum set to represent all spp of each taxa Measured overlap in minimum sets selected (number sq’s shared/number additional sq’s) Van Jaarsveld et al. 1998 Science 279: 2106
Evaluating biodiversity indicators Comparison of species sets Mean overlap 10% Min overlap 0 % - mammals/birds + termites Max overlap 21%- butterflies + beetles Different conservation areas are required to conserve different taxa Van Jaarsveld et al. 1998 Science 279: 2106
Additional limitations of species data Spatial biases in databases records typically reflect access false negatives Taxonomic bias in information quality undescribed spp limited resources limited taxonomic training
Evaluating use of landtypes in reserve design Venetia-Limpopo Nature Reserve, SA 350 km2
Evaluating use of landtypes in reserve design Venetia-Limpopo Nature Reserve, SA 350 km2 9 Land Facets - based on geology, soil profile and topography Reserve selection 1 km2 grid sq % representation of each landtype adjacency constraint Wessels et al 1999 Biol Cons 89: 21-38
Evaluating use of landtypes in reserve design How representative are the “selected” reserves? Tested by assessing diversity of Birds Dung beetles Assemblages vary with landtype Landtype reserves represent bird/beetle diversity
Evaluating use of landtypes in reserve design Cape Floristic Region, SA 122,000 km2 - > 6000 endemic plant species UNESCO World heritage site
Evaluating use of landtypes in reserve design Cape Floristic Region, SA 122,000 km2 102 broad habitat units (untransformed land) vegetation climate geology topography Reserve selection - current reserve selected + minimum set to achieve conservation target (%) by BHU
Evaluating use of landtypes in reserve design Cape Floristic Region, SA How representative are the reserves? Proteas - well sampled Vertebrates - fish, amphibians, reptiles BHU minimum set represented 79% of unreserved proteas 35% of unreserved vertebrates BHUs are a good surrogate for SOME Species
Summary Surrogates for overall biodiversity? Flagships NO Biodiversity Indicators NO Landtypes NO So what features should be used? Combine inexpensive land type info With other surrogates
NEXT Two contrasting case studies ISSUES TO CONSIDER Surrogates for: Ecological processes Promoting the persistence of biodiversity