Download
1 / 42
420 likes | 1.06k Vues
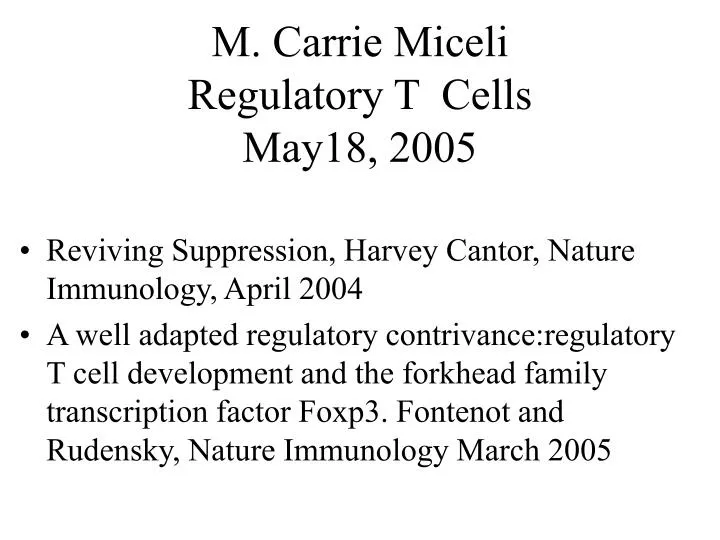
M. Carrie Miceli Regulatory T Cells May18, 2005 Reviving Suppression, Harvey Cantor, Nature Immunology, April 2004 A well adapted regulatory contrivance:regulatory T cell development and the forkhead family transcription factor Foxp3. Fontenot and Rudensky, Nature Immunology March 2005

E N D
M. Carrie MiceliRegulatory T CellsMay18, 2005 • Reviving Suppression, Harvey Cantor, Nature Immunology, April 2004 • A well adapted regulatory contrivance:regulatory T cell development and the forkhead family transcription factor Foxp3. Fontenot and Rudensky, Nature Immunology March 2005
How does the immune system prevent self reactivity while maintaining reactivity to invaders/non-self? • Clonal deletion/inactivation of auto-reactive cells • Regulatory T cells keep potentially pathogenic self reactive T cells in check through “suppressive” mechanisms
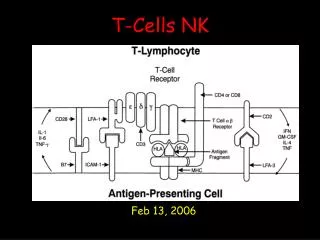
CD25+CD4 regulatory T cells play a role in maintaining peripheral T cell tolerance • Taboo of T “suppressor” cells • CD8+ • Complex regulatory networks mapping to I-J (within the MHC) • Molecular cloning of TCR and MHC disappointed • CD4+ Tregs gain respect • CD4+; CD25+;CTLA-4+;CD45RBlo;GITRhi • We need better markers, still heterogeneity • Foxp 3 dependent
Journal of Immunology 1995 155:1151 lymph nodes from a 2 month old balb c
Autoimmune disease Induced by adoptive transfer of lymphocyte populations depleted by antibody and complement
CTLA-4 is expressed constitutively on CD25+CD45RBlow CD4+ cells (but not a specific marker). F. powrie J exp Med . (a–c) CTLA-4 staining on permeabilized (a)CD45RBhighCD4+,(b)CD25+CD45RBlowCD4+, and © CD25-CD45RBlowCD4+ splenocytes. SSC, side scatter. (d–f) CTLA-4 expression on the progeny of (e) CD25+CD45RBlowCD4+ and (d and f) CD45RBhighCD4+ cells after transfer into immunodeficient mice. C57BL/6 recombination activating gene (RAG)2-/- mice received CD45RBhighCD4+ cells from C57BL/6 mice (CD45.2) (d) alone or (e and f) in combination with 105 CD25+CD45RBlowCD4+ cells from C57BL/6.SJL.CD45 congenic mice (CD45.1). 4 wk after transfer, cells from the mesenteric lymph nodes were stained for CTLA-4 and congenic marker expression b=CD4+CD25+
CD4+CD25+ (CD45low) inhibit autoimmune colitis. Anti–CTLA-4 treatment abrogates the function of regulatory T cells. Open control Ig Closed CTLA-4. Adoptive transfer of CD4 T cell into RAG deficient mice
Re-evaluation of CTLA-4 autoimmune phenotype • Could CTLA4 deficiency result in defective Treg function and thus autoimminty (rather than role of CTLA-4 on T cell autonomous regulation)? • CTLA phenotype rescued by complementing CTLA-4 -/- BM with wild type BM (mixed chimera). • CTLA-4 deficient bone marrow can make CD25+CD4+ (function vs development)
CD4+CD25+ Immunoregulatory T Cells Suppress Polyclonal T Cell Activation In Vitro by Inhibiting Interleukin 2 Production Angela M. Thornton and Ethan M. Shevach J. Exp. Med. 1998 188: 287-296.
Treg cells look like half activated anergic cells; IL-2 rescues Fig. 1. Characterization of CD4+CD25+ cells. (A) Total lymph node cells (left) or purified CD4+CD25+ cells (right) from BALB/c mice were stained with PE-conjugated anti-CD4 and biotin-conjugated anti-CD25 followed by FITC-conjugated streptavidin. (B) Purified CD4+ CD25 cells or purified CD4+CD25+ cells were double stained for CD25 and the indicated surface molecules. (C) Proliferative responses of CD4+ CD25+ cells. Cells (5 X 10⁴) were incubated with the indicated agents (10 ng/ml PMA, 1 mM ionomycin, 3 ng/ml IL-2, 3.0 µg/ml soluble anti-CD3, 3.0 µg/ml Con A, 10 µg/ml anti-CD28, or wells coated with 10 µg/ml anti-CD3) in the presence of AC (5 X 10⁴). Results are expressed as the mean of triplicate cultures.
CD4+CD25+ cells suppress the proliferation of CD4+ cells;need to be stimulated through their TCR . (A) CD4+CD25 cells (5 X10⁴) were incubated with plate bound anti-CD3 (triangles) or with 1.0 µg/ml soluble anti-CD3 (squares) in the presence of AC (5 X 10⁴) and the indicated number of CD4+CD25+ cells. (B) CD4+CD25+ cells do not suppress antigen-specific CD4+ cells from TCR transgenic mice. CD4+CD25 cells (5 ? 104) were purified from DO.11.10 SCID mice on a BALB/c background and stimulated with 0.5 µM ovalbumin peptide (amino acid 323-339; triangles) or 0.5 µg/ml anti-CD3 (squares) in the presence of AC (5 ? 104) and the indicated number of CD4+CD25+ cells. Results are expressed as the mean of triplicate cultures
A soluble factor does not mediate CD4+CD25+ induced suppression. (A) CD4+CD25- cells (5 × 10⁵) were cultured in 24-well plates in the presence of 3.0 µg/ml soluble anti-CD3 and AC (5 × 10⁵). The indicated number of CD4+CD25+ cells was added directly to the culture (squares) or to the transwell in the absence (triangles) or presence (circles) of AC (5 × 10⁵).
Fig. 7. CD4+CD25+ cells suppress IL-2 production. (A) CD4+ CD25- cells (5 × 10⁴), AC (5 × 10⁴), and 0.5 µg/ml anti-CD3 were cultured in the presence or absence of CD4+CD25+ cells (2.5 × 10⁴), supernatants were taken at the indicated times and IL-2 was quantified. Each sample was tested in triplicate. (B) RNA was purified from CD4+ cells stimulated in the presence or absence of CD4+CD25+ cells after 16 h using RNAzol B (Tel-test). RNA was separated by gel electrophoresis, transferred to nitrocellulose and probed for IL-2 message (top) or -actin message (bottom) by using an IL-2 PCR fragment or a -actin PCR product as a probe.
In vitro seems to work this way but in vivo data demonstrate some role for TGFB and IL-10 in some systems (in vivo vs in vitro or diverse Treg populations) • Ciriaco A. Piccirillo, John J. Letterio, Angela M. Thornton, Rebecca S. McHugh, Mizuko Mamura, Hidekazu Mizuhara, and Ethan M. Shevach. CD4+CD25+ Regulatory T Cells Can Mediate Suppressor Function in the Absence of Transforming Growth Factor ß1 Production and Responsiveness J. Exp. Med., Jul 2002; 196: 237 - 246.
What are the requirements for Treg development? • TCR ENGAGEMENT? • THYMOCYTE SELECTION
Thymic selection of CD4+CD25+ regulatory T cells induced by an agonist self-peptide Nature Immunology 2, 301 - 306 (2001) Martha S. Jordan…. & Andrew J. Caton • TCR transgenics (TS1) specific for the I-Ed/ HA peptide(S1)were crossed to HA transgenic (HA28) mice • The S1-specific T cells were not deleted • Many of the S1-specific CD4+ T cells were CD25+ and functioned as Treg cells. • Specificity for a self-peptide “directs” CD4+CD25+ T cell development. • Selection of CD4 requires a TCR with high affinity for a self peptide because thymocytes that bear TCRs with lower affinity do not develop along this pathway.
Thymic selection of CD4+CD25+ regulatory T cells induced by an agonist self-peptide Nature Immunology 2, 301 - 306 (2001) Martha S. Jordan…. & Andrew J. Caton Figure 1. CD4+CD25+ S1–specific T cells are generated intrathymically. (a) CD25+ thymocyte development in TS1HA28 mice. Flow cytometry was used to determine 6.5 expression on CD4+ LN cells and CD4+ SP thymocytes from TS1 and TS1HA28 mice. The 6.5Hi cells (indicated by horizontal lines) were then analyzed for CD25 expression. The percentages of 6.5Hi CD4+CD25- and CD25+ cells in TS1 versus TS1HA28 mice are shown. Data are representative of at least six experiments. (b) CD25 expression during ontogeny. Thymi and spleens from 2-day-old, 7-day-old and adultTS1HA28 mice were collected and cells stained with antibodies to CD4, CD8, CD25 and 6.5. The percentages of CD4+ SP, 6.5Hi, CD25+ and CD25- thymocytes and splenocytes from five mice per time-point were determined and absolute numbers calculated. ..
TReg cells are a normal product of thymic selection. Figure 1. TR cells may arise from relatively high-avidity interactions with self-peptide–MHC complexes, just below the threshold for negative selection (green area). This narrow avidity selection window ensures that Tr cells will constitute only a small fraction of the mature T cell pool and have a greater sensitivity to self-peptide–MHC than potentially pathogenic autoreactive T cells.
Expression of class II in cortical thymic epithelial cells is sufficient for Treg development • While some CD25+, CD4+ T cells can be found in class II knockouts, they do not suppress in vitro • Furthermore K14, but not class II -/-, CD25+CD4+ suppress IBD in an adoptive transfer model. • More proof that TCR engagement is required for survival/selection?
Tregs Develop in T Laufers K14 Mice (J Exp Med 194;p 427, 2001
K14 Tregs are anergic and suppressive, Expression of class II in cortical thymic epithelial cells is sufficient for Treg development
J Exp Med 198,1665, 2003 Autoimmune uvitis model Small amounts (barely detectable) of auto antigen expressed in the thymus required for Treg generation.
What are the requirements for Treg development? • TCR engagement in the thymus (high affinity but not so high as negative selection) • Higher percentage of thymocytes with high affinity TCR in context of auto antigen develop into regs • T cells of appropriate affinity are “instructed” to become Tregs • Selective sparing of pre-committed cells from negative selection or promotion of Treg lineage development? • higher percentage, but not higher absolute number • Preferential eliminaton of non-regulatory T cells rather than increased production of Tregs • TCR engagement serves as survival or expansion signal of Tregs pre-committed to that lineage.
Foxp3 transcription factor required for Treg lineage specificationIs a good marker except intracellular location limits its utility in purifying and identifying Tregs in non-permeabilized/live cellssee discussion paper for solution
Nature Immunology4, 330 - 336 (2003) Foxp3 programs the development and function of CD4+CD25+ regulatory T cells Jason Fontenot…Alexander Rudensky Figure 1.Foxp3 is specifically expressed in CD4+CD25+ regulatory T cells. (a) Real-time quantitative PCR for Foxp3 from purified T cell subsets. (b) Western blot analysis of Foxp3 in purified T cell subsets using rabbit anti-Foxp3 IgG.
Death at 4 weeks Figure 2.Generation and analysis of Foxp3 conditional mutant micea (d) Western blot analysis of Foxp3 in purified CD4+ T cells and (e) spleens and lymph nodes, at 21 d of age from littermate male Foxp3+ and Foxp3-. Black bar, 1 cm. (f) FACS analysis of CD4+ T cells from 28-day-old Foxp3- and littermate Foxp3+ male mice. Plots are gated on CD4+ cells and are representative of >5 mice analyzed.Foxp3 knocked out everywhereFoxp3 knockouts have big spleens and ln containing activated T cells by day 28,same phenotype at scurfy mutant/foxp3 mutant
Figure 3.Foxp3 is required for development of CD4+CD25+ regulatory T cells and does not affect CD4+CD25- T cell proliferation.(a) FACS analysis of lymph node cells and thymocytes from male Foxp3- and littermate Foxp3+ mice. Lymph node cell plots are gated on TCR+ cells. Thymocyte plots are gated on CD4+CD24lo cells. Demonstrates what a bad marker CD25 is since cant distinquish Tregs from activated
Figure 4.Neonatal transfer of CD4+CD25+ regulatory T cells rescues the lymphoproliferative syndrome in Foxp3-deficient mice.(a) Lymph node cellularity and total donor cells recovered from 21-day-old mutant and wild-type male mice. (b) Spleen and lymph nodes from 21-day-old male recipient mice. (c) Flow cytometric analysis of activation markers expressed by host CD4+ T cells from recipient male mice. Histograms are gated on CD4+Ly5.1+ cells. (d) Flow cytometric analysis of host- and donor-derived T cell populations. Plots are gated on TCR+ cells. All data are representative of at least four mice per experimental condition.
Figure 5Foxp3 programs the development and function of CD4+CD25+ regulatory T cellsa) MSCV MigR1 retroviral constructs and representative CD4+CD25- T cell population before infection: MigR1[Foxp3] (top), and MigR1[empty] (bottom). (b) Retroviral transduction efficiency of transferred cell populations. (c) Suppression of wasting disease and colitis by Foxp3-transduced cells. Percent weight change of RAG1-/- mice injected with retrovirally transduced cell populations.
IPEX IN HUMANS CAUSED BY FOXP3 MUTATION • Immune dysregulation, Polyendrocrinopothy, Enteropothy, X-linked • Early onset autoimmunity with • Lymphoproliferation • Diabetes, thyroditis, enteropathy, • Food allergies preventing normal food intake • autoimmune hemolytic anemia and thrombocytopenia, • severe infections • Onset 3-4 weeks • Usually, fatal in boys during early infancy or early childhood
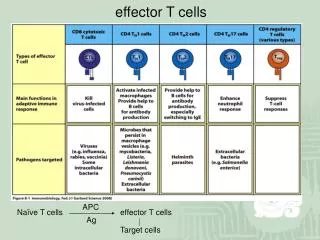
Twenty-first century Foxp3; Nature Immunology4, 304 - 306 (2003) Anne O'Garra & Paulo Vieira Figure 1.Equilibrium in the control of effector T cells.TReg cells expressing Foxp3 are produced in the thymus, but CD4+ cells in the periphery may also acquire regulatory function. Neonatal thymectomy or loss-of-function mutations in Foxp3 abrogate regulatory cells and cause wasting disease, autoimmunity and lymphoproliferation. The human disease IPEX is also caused by mutations in Foxp3. TReg cells inhibit activation and CD4+ cell effector function, thereby preventing these disorders. Triggering of dendritic cells (DCs) by bacterial products overcomes this suppression. The equilibrium between TReg cells and DCs is therefore crucial for the proper regulation of the immune response.
Requirements for Treg activity Antigen specific activation necessary for suppressive CD28 very important (IL-2 needed) IL-2 important IL-2 knockouts lethal lymphoproliferation Treg wanabees are there but need IL-2 added back to function as regs IL-2 alpha and beta receptor chain knockouts
Tregs are stimulated in an antigen specific manner, but once activated they inhibit both CD4 and CD8 responses in an antigen non-specific manner. • May act indirectly (at least in part) through APCs (I.e decrease B7 on APC) • In in vitro models, a soluble factor does not mediate CD4+CD25+ suppression (cell:cell contact required); in vivo IL-10 is important • CD4+CD25+ cells suppress IL-2 production • IL-2 mRNA and secreted IL-2 protein
Figure 1. Linkage of central and peripheral tolerance by thymic production of natural CD25+CD4+ Treg cells that contribute to peripheral self-tolerance. A reduction in CD25+CD4+ Treg cells or attenuation of their suppressive activity may elicit autoimmunity, tumor immunity, microbial immunity and allergy. In contrast, an increase in the number of Treg cells or augmentation of their suppressive activity may establish transplantation tolerance and maintain feto-maternal tolerance. Treg cells may control effector T cells (Teff cells) either directly or indirectly through APCs. †, death.
Powrie Model, NI2:816 (2001) In our quantitative model, the maintenance of self-tolerance is dependent on the ratio of TR cells to potentially pathogenic autoreactive T (TPATH) cells that respond to a given peripheral antigen. In a given lymph node, this ratio will be dynamic and fluctuate depending on the infectious status of the local tissue. In the steady-state, immature DCs may traffic through peripheral tissues; here they can efficiently phagocytose proteins and apoptotic debris arising from normal cell turnover in the tissue without becoming activated(Fig. 3a). Even in the absence of inflammation, a few of these immature DCs will migrate to the draining lymph nodes where they will present a panel of self-peptides to both TR cells and TPATH cells108-110. However, autoimmunity will not occur, perhaps because the autoreactive T cells are insufficiently activated by immature DCs or, alternatively, because the immature DC preferentially stimulate TR cells. Consistent with the latter hypothesis, TR cells can respond to much lower concentrations of cognate peptide ligands than conventional naïve CD4+ T cells25 and immature DCs express relatively low amounts of MHC class II and costimulatory molecules.
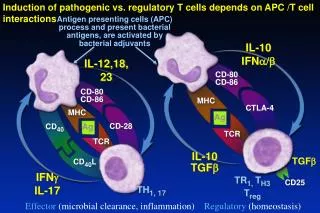
Model for the control of pathogenic immune responses by TR cells.
Model for the control of pathogenic immune responses by TR cells. (a) In the steady-state, low numbers of immature DC traffic to the draining lymph node (LN) from uninflamed tissues and present self-peptides (yellow) to both TR and TPATH cells. The relatively high ratio of TR:TPATH cells, together with the intrinsically higher affinity of the TR cells, leads to low-level activation of the TR cells (red arrow) and inhibition of TPATH cells (green arrow). iDC, immature DC. (b) During an immune response high numbers of activated mature DCs traffic to the LN where they present peptides derived from both self (yellow) and foreign antigens (red). This strong stimulus (red arrows) leads to activation not only of T cells specific for the infectious agent (TE cells), but also to full activation of the TR cells. This results in their proliferation and a transient loss of suppressive function, which, in turn, allows activation and expansion of TPATH cells. mDC, mature DC. (c) After the infectious agent is cleared, in the absence of foreign peptides, TE cells either die or become memory T cells (TM). The regulatory phase is characterized by presentation of self-peptides, again leading to competition between TR and TPATH cells. As both have proliferated, the ratio of TR:TPATH cells is maintained so that regulatory activity dominates; this leads to the inhibition of TPATH cells and down-regulation of APCs. To prevent a chronic pathogenic inflammatory response, TR cells may also migrate to the inflammatory site
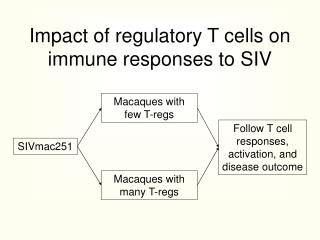
Nature Immunology 6, 353 - 360 (2005)Published online: 22 March 2005; | doi:10.1038/ni1181Natural regulatory T cells in infectious diseaseYasmine Belkaid & Barry T RouseFigure 2. Manipulation of natural Treg cells as a therapeutic approach during infection.The interactions between a host and a pathogen range from uncontrolled pathogen growth to sterile elimination. Blockade or enhancement of natural Treg cell function may represent a therapeutic approach at each 'extreme' of the host-pathogen interaction. Excess control of effector immune responses by natural Treg cells can lead to uncontrolled growth of the pathogen and eventual death of the host. In such cases, prevention of natural Treg cell function may restore the capacity of the host to efficiently control infection. At the other 'extreme' of the host-pathogen interaction, effector immune responses can efficiently eliminate pathogens. This situation can lead to 'unleashed' effector immune responses and immunopathology. In the most extreme scenario, the host can die from uncontrolled immune responses. For controlling immnopathology, enhancement of natural Treg cells function may represent a therapeutic approach.
Nature Immunology 6, 353 - 360 (2005)Published online: 22 March 2005; | doi:10.1038/ni1181Natural regulatory T cells in infectious diseaseYasmine Belkaid & Barry T RouseTable 1 Microbial infections for which a regulatory function for natural Treg cells has been suggestedMicrobe Species Antigen specificity ReferenceHelicobacter hepaticus Mouse ND 8,10 Human Helicobacter pylori Mouse ND 12,49 Human Listeria monocytogenes Mouse ND 38Pneumocistis carinii Mouse ND 13Leishmania major Mouse Yes 16-18,23,37Schistosoma masoni Mouse Yes 19,20Candida albicans Mouse ND 14,80Herpes simplex virus Mouse ND 22,28Friend virus Mouse ND 30,75Human immunodeficiency virus Human Yes 32-34,59,60Hepatitis C virus Human Yes 21,35,36Cytomegalovirus Human ND 32Murine AIDS Mouse ND 31Feline immunodeficiency virus Cat ND 56,81ND, not done.
Table 2 Functions of Treg cells during infection Reduced Tregs Equilibrium betweenTreg cells/effector cells Excess TregsAdvantages for: Host Pathogen clearance Maintenance of protective immunity Control of excessive immune responses (immunopathology) Microbe Persistence and/or transmission TransmissionDisadvantages for: Host Tissue damage Maintenance of reservoir Prevention of effector responses Disease reactivation Microbe Microbe clearance Host destruction