Download
1 / 18
230 likes | 2.01k Vues
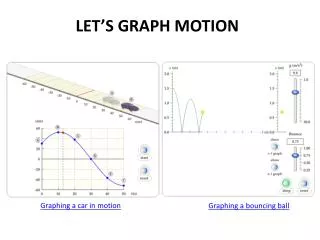
Below is a graph of a balls motion. Which of the following gives the best interpretation of the ball’s motion?. The ball moves along a flat surface. Then it moves forward down a hill, and then finally stops. The ball doesn’t move at first. Then it moves forward down a hill and finally stops.

E N D
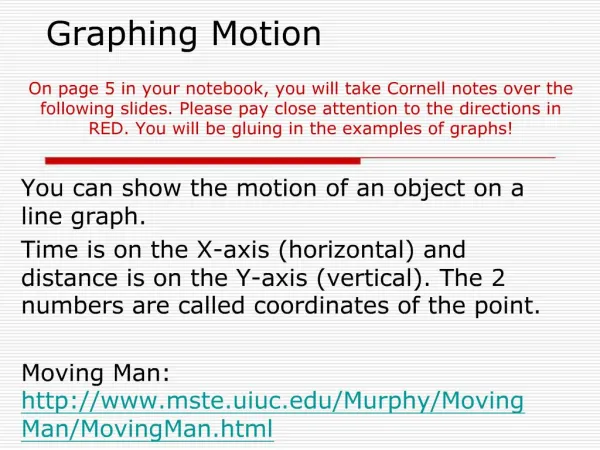
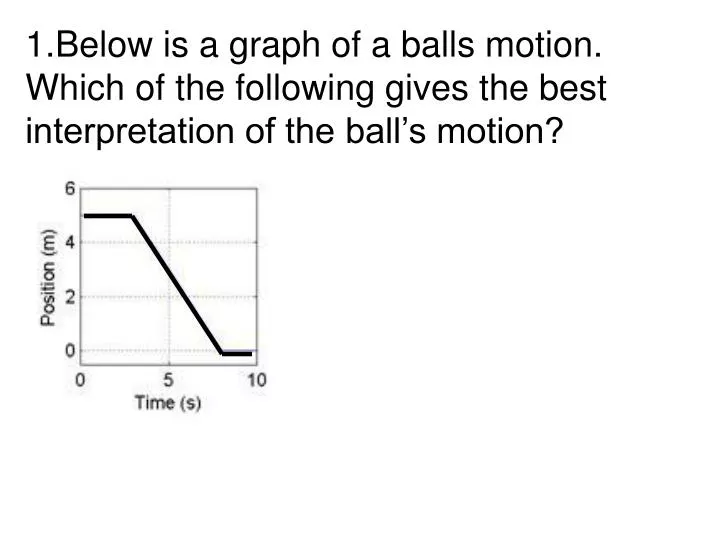
Below is a graph of a balls motion. Which of the following gives the best interpretation of the ball’s motion?
The ball moves along a flat surface. Then it moves forward down a hill, and then finally stops. • The ball doesn’t move at first. Then it moves forward down a hill and finally stops. • The ball is moving at constant velocity. Then it slows down and stops. • The ball doesn’t move at first. Then it moves backwards and then finally stops. • The ball moves along a flat area, moves backwards down a hill and then it keeps moving.
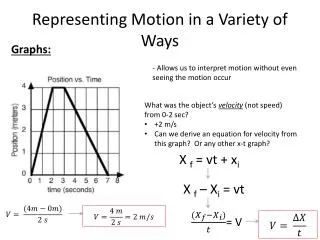
2. Draw a velocity-time graph would best depict the following scenario? A man starts at the origin, walks back slowly and steadily for 6 seconds. Then he stands still for 6 seconds, then walks forward steadily about twice as fast for 6 seconds.
3. For the same scenario as # 2, which position-time graph best depicts the motion?
4 A car is traveling along a road. Its velocity is recorded as a function of time and is shown in the graph below.
5. Which of the following position-time graphs would be consistent with the motion of the car in question #4?
6. A car is moving forward and applying the break. Which position-time graph best depicts this motion?
Stopping Distance. Consider two cars, a 700kg Porsche and a 600kg Honda Civic. The Porsche is speeding along at 40 m/s (mph) and the Civic is going half the speed at 20 m/s. If the two cars brake to a stop with the same constant acceleration, lets look at whether the amount of time required to come to a stop or the distance traveled prior to stopping is influenced by their initial velocity. Perkins’ Phys1010 Homework 2
Using Moving man Select the accelerate option and set the initial velocity, initial position, and an acceleration rate so that the walking man’s motion will emulate that of the car stopping with constant acceleration.
7. If you double the initial walking speed, the amount of time it takes to stop • is six times longer • is four times longer • is two times longer • does not change • is half as long
8. If you double the initial walking speed, the man walks … before coming to a stop. • Half the distance • four times farther • three times farther • two times farther • The same distance
9. If you triple the initial walking speed, the walking man goes … before stopping. • one third as far • One ninth as far • three times farther • six times farther • nine times farther
Notes from Perkins’ homework While moving man is useful to answer this question, equations give us the same result. Use Velocity = Initial velocity + acceleration x timeor acceleration = (change in velocity)/(time elapsed)which is the same as (time elapsed) = (change in velocity)/acceleration. So it will take 2 times as long to stop if the initial velocity is 2 times larger and the acceleration is the same. distance traveled = (initial velocity) x time + (1/2 x acceleration x time x time)
10. If the acceleration is zero, the man must be standing still. • True • False
11. Velocity and acceleration are always the same sign (both positive or both negative). • True • False
12. If the speed is increasing, the acceleration must be positive. • True • False
Notes from Perkins’ homework A negative acceleration indicates that the acceleration points in the negative direction. Under these conditions, if the man is moving in the positive direction, the negative acceleration will be acting to slow him down (velocity and acceleration point in opposite directions). If the man is moving in the negative direction, the negative acceleration will be acting to speed him up (velocity and acceleration point in the same direction).