Download
1 / 38
410 likes | 1.15k Vues
MASS SPECTROMETRY IN PROTEOMICS The advantages of identifying proteins via mass spectrometry as compared to traditional methods include: High sensitivity (femtomole to low picomole range), allows analysis of Coomassie- and silver-stained proteins.

E N D
The advantages of identifying proteins via mass spectrometry as compared to traditional methods include: • High sensitivity (femtomole to low picomole range), allows analysis of Coomassie- and silver-stained proteins. • High specificity provides unique protein identification. • Mass determination of several peptides from a protein results in verification of a significant part of the protein sequence. • Identification of several proteins in a single sample can be done; many samples can be processed in parallel. • If the protein is identified as "unknown", the sequences obtained by mass spectrometry can be used to query EST and genomic databases. The identified nucleotide sequences can then be used for cloning the gene.
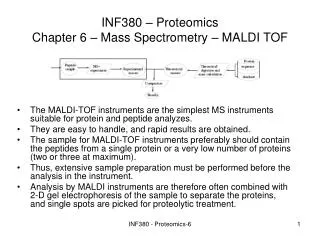
Outline of mass spectrometric analysis of proteins from SDS gels Digestion A few percent MALDI Peptide Map To identify proteins from 1-D and 2-D gels, the protein spots are excised and placed in 96-well plates. The gel plugs are washed, and cystine residues are reduced and alkylated. The protein is cleaved with trypsin and the peptides generated are eluted from the gel piece. A small aliquot is analyzed by MALDI mass spectrometry and the masses of the tryptic peptides are determined.
Digestion The digested sample is purified by chromatography on a microcolumn packed in the tip of a glass capillary. The sample is eluted into 0.3-1 mL, and analyzed by nano-electrospray tandem mass spectrometry. In ESI, a strong electrical charge is imparted to the solvent Containing the protein
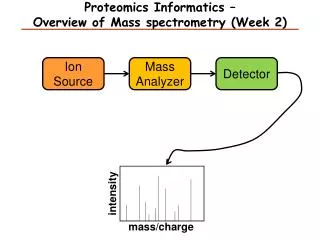
Outline of mass spectrometric analysis of proteins from SDS gels • Ionization MALDI (Matrix-Assisted Laser desorption/ionisation ESI (electrospray ionization) 2. Mass spectrometer (separation based on mass/charge of the protein, m/z ratio) 3. Activation 4. Mass spectrometer (Mass determination)
Outline of TOF-TOF analysis In TOF-TOF analysis, the separation in MS1 is used to select ions of a specific mass. These are then broken up either by smashing into neutral gas molecules (“collision induced dissociation”) or by further laser irradiation. The mixture of fragments is then subjected to mass analysis (MS2).
Outline of MALDI mass spectrometric analysis Protein or peptide sample is spotted on a metal plate, being co-crystallized with “matrix”, typically 3,5-dimethoxy-4-hydroxycinnamic acid (sinapinic acid), α-cyano-4-hydroxycinnamic acid (alpha-cyano or alpha-matrix) or 2,5-dihydroxybenzoic acid (DHB). The matrix absorbs light from a UV laser, and co-volatalizes with the sample, which then enters the mass spectrometer.
Outline of mass spectrometric analysis Sample is inserted into the mass spectrometer. A vacuum is drawn. The laser is fired and the resultant charged ions are accelerated by a fixed high voltage electric field. Larger ions move slower than smaller ions, and so their time-of-flight (TOF) defines their masses. This is an example of a sector MS, in which the mass differences are detected by analyzing the deviation of the ions in a magnetic field. MS instruments can have a linear detection arrangement, or a reflective mode (“reflectron”), in which the ions are caused to follow a parabolic path back to the detector – which increases the path length and hence the mass accuracy.
Outline of mass spectrometric analysis of proteins from SDS gels • Ionization MALDI (Matrix-Assisted Laser desorption/ionisation ESI (electrospray ionization) 2. Mass spectrometer (separation) 3. Activation 4. Mass spectrometer (Mass determination)
Activation step during Mass Spectrometry After selection by m/z ratio, proteins are broken into smaller fragments. Send proteins through argon-filled chamber Collision with gas molecules and the vibration energy generated causes the proteins to break into two pieces (b and y pieces, the amino and carboxyl pieces respectively) Breaks can occur anywhere in the protein
This is fed into the second MS unit, which is operated under conditions that lead to partial fragmentation of the peptide. The resulting masses are measured.
The mass values are then compared to those theoretically obtained from fragmentation of known peptide sequences. • The high mass accuracy and high resolution in the mass spectra allow very confident sequence assignments.
To query sequence databases, the peptide mass and sequence are combined into a Peptide Sequence Tag. This results in a very high search specificity. • Unique hits in the database can be obtained with only 3-4 amino acids. • When a protein has been identified, its theoretical fragmentation is predicted and compared to the MS/MS spectrum for assignment of other peaks. This allows validation of the identification. • This procedure is repeated for every fragmented peptide in the sample and leads to additional verification of the result or identification of other proteins in the sample.
Matching proteins in the database query are scored and ranked by the number of matching peptide masses, mass accuracy and protein size. In many cases, as shown above, you can unambiguously identify the protein. A large number of different peptides within the protein sequence correspond to the MALDI-MS mass values.
Some protein samples cannot be identified by the MALDI-MS peptide masses. • The number of peptide masses may be too low for a specific database query. • The gel piece may contain a mixture of proteins. • The protein is novel and the sequence is not present in the database. • In this case, more specific database queries can be performed for some of the peptides using partial sequence information derived by MS analysis.
Note: You can use the protein sequence information to produce oligonucleotide sequences that can be compared to available DNA sequence databases. Since each protein produces several peptide sequences, this provides redundancy and allows confidence in identification of genes.
ICAT Technology Gygi SP, Rist B, Gerber SA, Turecek F, Gelb MH, Aebersold R (1999). Quantitative analysis of complex protein mixtures using Isotope-Coded Affinity Tags. Nature Biotechnology17:994-999.
The main difficulty of applying original methods of mass spectrometry to mixtures of proteins (as found within cells) is that the methods were not capable of monitoring changes in concentrations of specific proteins. • A second problem is that these methods are biased towards highly abundant proteins, and lower abundance regulatory proteins are seldom detected when total cell lysates are analyzed. • Isotope-Coded Affinity Tag (ICAT) technology addresses both of these problems.
ICAT technology involves: • A pair of chemical reagents that react with sulfhydryl groups in proteins, that can specifically add mass, and that provide a means for selective purification of the modified peptides. • One of the pair of reagents contains deuterium, and this means that the same peptide modified by the two different reagents can be distinguished using MS. • Prior to MS analysis, the treated protein samples are subjected to proteolysis and the modified peptides are isolated by affinity chromatography.
MS is used here to quantify the different modified peptide-pairs. LC-MS Tandem MS is used here to identify the individual modified peptides. MS-MS
ICAT technology works because: • A short sequence of contiguous amino acids (5-25 long) is sufficient to uniquely identify a protein. • Pairs of peptides tagged with the light and heavy ICAT reagents are chemically identical, and there provide excellent mutual internal standards for quantification. • Measurement of the ratios of the upper and lower mass components of the peaks of pairs provides a very accurate measurement of the relative abundances of the peptides and hence the proteins.
Test of the method • Six proteins were selected, and two mixtures of the proteins were made, having different but known compositions. • The two mixtures were separately labeled with the ICAT reagents. They were then mixed, treated with protease, the tagged peptides affinity purified, and separated using HPLC. • Each protein produced several peptides. These were analyzed using MS (to determine the proportion of the two mass isoforms) and MS-MS to get the sequences of the individual peptides.
MS analysis of material eluting at one time point from the HPLC run. Four mass doublets are identified. The proportions of each can be measured easily. MS-MS sequencing of the peptide at a m/z ratio of 998 is shown in the next figure.
MS-MS analysis of the m/z = 998 peptide. Note the process has high redundancy (multiple peptides for specific proteins). Also tagging and enrichment for cysteine-containing peptides greatly reduces the complexity of the analysis.
Second test of the method • Used yeast growing either in 2% galactose, or in 2% ethanol. • Glucose repression causes minimal expression of large numbers of proteins with metabolic functions required for growth on other carbon sources. This effect is reversed by growth in the absence of glucose in the presence of ethanol or galactose. • They isolated and labeled 100 mg soluble protein from each. 2% of the sample was analyzed. • Sequence information was collected for more than 800 different peptides. • Table 2 shows results for selected genes (34 in all).
Second test of the method • This illustrates 10 genes identified as being glucose repressed and 21 other genes for comparison. • Genes known to be expressed during growth on galactose (GAL1, GAL10) or ethanol (ADH2, ACH1) were detected and quantified. • Multiple peptides were found for some proteins (i.e. PCK1 produced five, and they gave a mean ratio of 1.57 ±0.15 (95% confidence), with an error of <10%). Changes are in agreement with literature and with changes in staining intensities on SDS-PAGE.
ICAT method can perform analyses that other methods (such as DNA microarrays) cannot • Isozymes of Alcohol dehydrogenases (ADH1 and ADH2) are 88% identical in the coding region, yet could not be distinguished by DNA microarrays. • The two forms are 93% identical at the amino acid level, yet could be distinguished by ICAT method - that ADH2 is present at 200 times more in ethanol compared to galactose growth
The case of ADH1 and ADH2 • Expression of the alcohol dehydrogenase family of isoenzymes allows yeast growth on hexoses (ADH1) or ethanol (ADH2). • ADH2 is both glucose and galactose repressed. It converts ethanol to acetaldehyde. • In the presence of sugar, ADH1 converts acetaldehyde to ethanol. • Regulation of these isoenzymes is one of the keys to carbon utilization in yeast. • These isoenzymes differ only by a single valine to threonine change. Can they be separated and quantified by the ICAT method?
The case of ADH1 and ADH2 • Yes! The detected ICAT peptides differ in HPLC retention time by >2 min, and the mass by 2 Da. • ADH1 was expressed about 2-fold higher when galactose was the carbon source, compared to ethanol. Ethanol induction of ADH2 was a 200-fold increase compared to galactose induction.
Summary • The ICAT method is an ideal basis for the automated, quantitative global proteome analysis. • It reduces the complexity of the peptide mixture since it relies on selective analysis of cysteine-containing peptides. • A theoretical tryptic digest of the entire yeast proteome (6,113 proteins) would produce 344,855 peptides. Only 30,619 contain cysteine. • This reduces complexity but maintains quantification. • The ICAT coupling reaction can be done in SDS and urea (i.e. the proteins are maintained in a denatured state, and so are not likely to degrade).
Summary • Avidin affinity chromatography is particularly well suited for the HPLC-MS procedures, since it allows one-step, compatible clean up of the digested, coupled sample peptides. • The purification step eliminates many abundant components, so increases the sensitivity. • The method can be redundant, ie. reproducible. • The method is accurate and has a reasonable dynamic range (up to 100-fold changes can be measured). • Different specificities of ICAT reagents can be envisaged for proteins that lack cysteines.
Han DK, Eng J, Zhou H, Aebersold R Quantitative profiling of differentiation-induced microsomal proteins using Isotope-Coded Affinity Tags and mass spectrometry. Nature Biotechnology19:946-951 (2001).
Interested in looking at the protein components of microsomal membranes. • Classical protein separation methods don’t work well with membrane proteins; it’s particularly hard to keep the proteins soluble during the isoelectric focusing step. • Applied ICAT techniques to HL-60 microsomal membrane proteins to look at cellular differentiation. • Note that ICAT technique does not involve 2D-gel step. This allowed the analysis of membrane proteins.
A systemic approach to the analysis of protein phosphorylation Zhou H, Watts JD, Aebersold R Nature Biotechnology 19:375-378 (2001)
Reversible protein phosphorylation controls a wide-range of biological functions. • Determination of the sites of protein phosphorylation is important. • Previous methods require purification of individual proteins – very slow and laborious. • Need rapid and general method for identification of protein phosphorylation in complex mixtures. • This is a description of such a method, using MS.