Download
1 / 25
250 likes | 264 Vues
United States Migration Patterns (Internal). Internal US Migration (interregional). U.S. settlement patterns Movement is East to West Colonial settlement clustered on the East Coast Limited to coastal areas by British Proclamation Line of 1763 Intervening obstacle Appalachian Mountains

E N D
Internal US Migration (interregional) • U.S. settlement patterns • Movement is East to West • Colonial settlement clustered on the East Coast • Limited to coastal areas by British • Proclamation Line of 1763 • Intervening obstacle • Appalachian Mountains • Gravity Model • Ties to Atlantic trade • Improved transportation opens interior • Scots – Irish frontiersmen • Erie Canal
Internal US Migration (interregional) • Westward Expansion/Manifest Destiny • “US should possess the whole continent” • Oregon Trail (1840s) • California Gold Rush (1849) • Settlement of the Great Plains • Homestead Act (1862) • remember link to immigration • govt. encourages migration • Railroads (comp. 1869) • sells land grants • Becomes productive • Steel plow, wind mills • Barbed wire
Great Migration • 7 million African-Americans • 1910 – 1970 • Two waves (WWI and WWII) • rural South to urban North
Great Migration • 7 million African-Americans • 1910 – 1970 • rural South to urban North • Push factors • Economic • poverty, share-cropping
Great Migration • 7 million African-Americans • 1910 – 1970 • rural South to urban North • Push factors • Economic (in addition to sharecropping) • eviction due to mechanized farming • Cultural • discrimination • Jim Crow laws • Plessy v Ferguson (sep. but equal) • = separate but NOT equal • Violence • KKK, lynching
Great Migration • 7 million African-Americans • 1910 – 1970 • rural South to urban North • Pull factors • Industrial jobs (economic) • White men off fighting world wars • Armed forces are segregated • better treatment (cultural)? • face segregation and discrimination • Some suffer from ghettoization • De facto vs. de jure segregation • “Great Return” or The “New Great Migration” • Since 1980s • Urban North to Urban/Suburban South • African-Americans return to South • Chicago lost 200,000 African Americans in the last census • What push/pull factors are involved in this counter-migration? • Could this be “black flight”? • Middle-class African-Americans leaving city due to cultural push factors
Interregional migration in the United States • Migration from rural to urban areas • “urbanization” • Stage 2 (industrialization) • US = late 1800s thru mid 1900s • Primary reason = economic • What effects does urbanization have? • Secular attitudes • 1920s culture clash • children = economic burdens • LOWER CBR/NIR • Migration from urban to rural areas (Rav. #?) • “counterurbanization” • form of countermigration • primary reasons are cultural • country lifestyle, easier pace
Migration from Rust Belt to Sun Belt • Push factors • weather • cold winters • declining industry • “Rustbelt” • high costs • Unions • “closed” shops • high regulation • high taxes • e.g. to combat polluting effects of industry • business move to avoid higher costs • not having these traits becomes pull factor for other areas (Sunbelt) • job growth happens elsewhere = employees follow • urban decay • see suburbanization
Sun Belt • Pull factors • warmer climate • “Sunbelt” • now with air conditioning! • Low business costs • more in Unit #6: Economic Dev. • non-union environment • South = “right-to-work” states • Weakens unions • regulation/taxes kept low • on purpose to attract industry • high population growth • Since 1970 • +25 electoral votes • 2000 – 30 • 88% of all US pop. growth
Changing Center of the U.S. Population • Center of population has moved consistently from east to west • representing evidence of westward migration, territorial expansion, Manifest Destiny • Note southward trend since mid-20th century • Represents Rustbelt to Sunbelt migration
Intraregional migration in the United States • Migration from “city” to suburban areas • “suburbanization” • post WWII = biggest US migration flow • what was the situation? Historical background • Last two decades = Great Depression & WWII • enormous pent up demand!!!! • Rationing is over! • therefore….spend, spend, spend = consumerism • housing shortage → govt. programs → returning veterans • FHA = lower down payment, longer mortgages • GI Bill = low interest loans, education costs (begins switch from secondary to tertiary economy) • optimism = baby Boom = space needed to raise children • Automobiles (Americans loves automobiles!) • become ‘necessity’, highways built, can live farther from work • Is there a countermigration from suburb to city = • “gentrification” (this will be covered in Unit 6) • The movement of middle class (mostly white) people into formerly “distressed” inner city neighborhoods
tremendous growth of the suburbs in 20th century America • “suburbs” are a part of the urban region. • movement from the city to the suburbs = intraregional • movement from rural areas to city/suburbs = urbanization = interregional
Suburbanization (mostly cultural) Push Factors Pull factors suburban lifestyle space detached homes, yards, garages room for kids low poverty low crime poverty and crime are linked not race/ethnicity and crime schools safe, well-funded, no gangs good government better services low taxes “American dream” or is it “homogeneity”? • urban decay • crowded housing (apts.) • poverty • crime • 1960s riots • schools • underperforming • school desegregation/busing • political machines • corruption • taxes are high! • scared of the “other” • new immigrants = different • African-Americans • results in “white flight” • mostly white middle-class flee urban problems • increases inner city decline as middle class taxes flow from city to suburbs
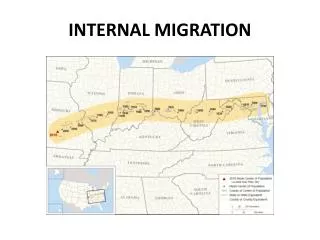
Where do you see evidence of suburbanization on this map? • Population gain in counties surrounding Cook/Chicago. • Population loss in Cook/Chgo • Population gain in areas outside St. Louis. • What other migration trend can be supported by this map? • Urbanization • Population loss in rural areas • Other? • “rural” counties with population gains are mostly small cities with universities. • represents small-scale urbanization and brain gain migration to university towns.
Intraregional Migration in the United States • Note that the biggest flow is from city to suburbs. • Suburbanization • Biggest migration trend in post-WWII America! Know this! • Note that all flows have an opposite flow though not necessarily of the same magnitude • countermigration