Download
1 / 53
550 likes | 1.2k Vues
Obesity and Diabetes. A Growing Epidemic. By: Jennifer Brierley. Section One. Developing a Thesis and Finding Data. What is obesity? What is diabetes? How are obesity and diabetes related?. BMI = mass (kg) (height (m)) 2. What is Obesity?.

E N D
Obesity and Diabetes A Growing Epidemic By: Jennifer Brierley
Section One Developing a Thesis and Finding Data
What is obesity? What is diabetes? How are obesity and diabetes related?
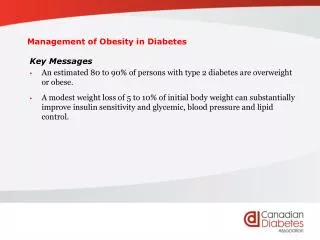
BMI = mass (kg) (height (m))2 What is Obesity? Obesity by definition is an increase body weight caused by excessive accumulation of fat. How do you know if someone is obese? What is a Body Mass Index? A Body Mass Index commonly known as your BMI is a common measure expressing the relationship of weight-to-height. A person is obese when their Body Mass Index (BMI) exceeds 30 and a person is considered overweight when their Body Mass Index is between 25 and 30.
Jen Brierley’s BMI Weight = 52 kilograms Height = 1.57 meters BMI = mass (kg) height (m)2 BMI = 52 (1.57)2 BMI =21 I am not obese! Quick Data Fact • The Body Mass Index Formula is a Mathematical Index • A mathematical index is an arbitrarily defined number that provides a measure of scale. • It is determined by a mathematical calculation that combines various attributes of each case in order to make comparisons. • Mathematical Indices are found in Unit 3 (Tools for Analyzing Data)
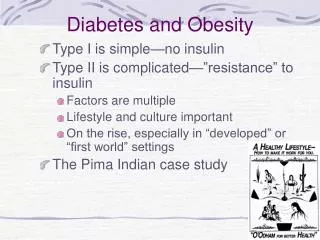
Diabetes is a chronic, metabolic condition that results from the body’s inability to sufficiently produce and/or properly use insulin What is Diabetes? • There are 3 types of diabetes: • Type 1 Diabetes • Type 2 Diabetes • Gestational Diabetes Quick Fact! Type 2 Diabetes is one of the fastest growing diseases in Canada with more than 60,000 new cases yearly. Type 2 Diabetes can be prevented!
How are Obesity and Diabetes related? I researched the risk factors, health risks, symptoms, and prevention methods for obesity and diabetes. I then drew a mind map in order to examine how obesity and diabetes are related.
Frequent Urination Breathing Problems Gallbladder disease Female Erectile dysfunction Unusual thirst Reduced blood Supply to limbs Nerve damage Types of Cancer Fatigue Blindness Sex Male Sleeping Problems stroke Osteoarthritis Health Risks Symptoms Health Risks Heart disease Unexplained weight loss Given birth to A baby > 9 lb Type 2 Diabetes Date of birth Socioeconomic influences African Adult Have had gestational diabetes Aboriginal Child Metabolic Causes (risk factors) Age Asian Cultural Genetics Body weight South Asian Environmental Hispanic Factors Being age 40 + Behavioral Obesity BMI Abdominal obesity Non-abdominal obesity Prevention High blood pressure Height High Cholesterol/other fats in the body Causes Be physically active Achieve healthy weight And maintain it High risk ethnic groups Imbalance involving Excessive calorie consumption Limit intake of Fat and sugar South Asian Aboriginal Inadequate Physical activity Hispanic African Asian Maintain normal Blood pressure Don’t smoke Eat regular, Balanced meals (include Four food groups) Inadequate Energy expenditure Keep cholesterol And other fats Within target level MIND MAP
After analyzing the connections I was interested in whether or not Canadians could reduce the risk of diabetes if in fact they started to live a healthy lifestyle. Thesis Question What effect do Canadian’s knowledge, attitudes and behaviors concerning obesity have on type 2 diabetes?
The better Canadian’s knowledge, attitudes and behaviors are concerning obesity, the lower the chance of developing type 2 diabetes will be • Obesity and diabetes are directly correlated • As the population as a whole becomes healthier, the prevalence of type 2 diabetes will decrease among Canadians What do knowledge, attitudes and behavior mean? • Knowledge is if the population knows the facts and the statistics related to the topic • Attitude is how much the population care about the issue and whether they are willing to engage in the topic. • Behavior is what the population is doing. Are they dealing with the topic issue? Are they putting their knowledge and attitudes into effect? • Will examine Canadian’s knowledge, attitudes, and behaviors related to obesity in order to determine what type of intervention would lead to reducing obesity. • Will examine Canadian’s knowledge concerning the health factors related to obesity and whether or not Canadian’s are aware of the effect obesity has on developing type 2 diabetes. Objectives: Hypothesis
Section Two Using Diagrams to find Connections and Organize Ideas
. Does a person have knowledge about diet? No Yes Does the person have poor diet? Does a person have a good attitude towards their diet? Yes Yes No No unhealthy Does a person have good behaviors towards their diet? No Is the person overweight? healthy No High risk of developing diabetes Low risk of developing diabetes Diet’s Role in Developing Diabetes
Obesity Genetics High risk ethnic groups Had gestational diabetes Given birth to a baby >9 lb’s High cholesterol Being age 40 + High blood pressure Network Diagram
Network Diagram • Table that corresponds with network diagram. • + represents a relationship • represents no relationship • ----- represents that there is no relationship with itself
Canada Ontario Quebec Sex Male Female Age 14 and under 15 - 25 26 - 49 50 + Level of education obtained Elementary school High school College University Post graduate Organization Chart
Tree Diagram Diabetes Type 1 Type 2 Does not apply to project Causes (risk factors) Prevention Obesity Genetics High risk ethnic groups High cholesterol Had gestational diabetes High blood pressure Being age 40+ Given birth to a baby > 9 lb’s Abdominal Non abdominal Does not apply to project Be physically active Achieve healthy weight and maintain it Don’t smoke Maintain normal blood pressure Limit intake of fat and sugar Keep cholesterol and other fats within target level Eat regular, balanced meals (include 4 food groups)
Part One: Obesity in Canada Part Two: Diabetes in Canada Part Three: Effects of Obesity on Diabetes (correlation between the two) Section Three Analyzing Secondary Source Data
Part One: Obesity in Canada
Obesity Rates in 1978/79 and 2004 by Age Group • The distribution of this graph is left skewed because the greatest frequencies are near the right end of the bar graph, although the 2004 data could be viewed as a mound shaped distribution. • The greatest obesity rates occur among adults ages 45 to 64. • This is accurate as the onset of type two diabetes is around age 40
Mean 1978/79 = 6+9+13+17+20+20+11 7 =13.7 Mean 2004 = 11+21+20+30+30+25+24 7 = 23.0 23.0 –13.7 = 9.3 This is showing that the average percent of obese people in Canada has risen about 9% since 1980. Median 1978/79 = 17 Median 2004 = 30 30 –17 = 13 The median and mode also display the increase in obesity rates since 1980. The median increase by 13 % and the mode by 10%. Mode 1978/79 = 20 Mode 2004 = 30 Calculations
Trends in Obesity Rates Calculation: Coefficient of determination (r2 ) = 0.8296 83% of the variation in the percentage of obese people is due to the variation of the year. This graph clearly and effectively shows that Canadians need to pay attention to their weight because since 1991 obesity rates have increased by rapidly compared to the obesity rates from 1978 to 1991.
Obesity Prevalence in 2000/01 of the population ages 20 to 64 (in this graph obesity is measured by someone with a BMI>27)
Prevalence of Obesity in Canada from 1985 to 1998
Mound Shaped Distribution Percentage distribution of body mass index (BMI) by sex (2004) This shows that obesity is a rising problem in Canada because in men the percentage of obesity is only 10% below the percentage of the population with a normal weight and in women it is only 20% below.
Obesity Rates by Fruit and Vegetable Consumption (2004) MMMMM Left Skewed Distribution
Obesity Rates by Physical Activity Level (2004) Left Skewed Distribution
Obesity Rates by Level of Education Obtained (2004)
Part Two: Diabetes in Canada
Prevalence Rate of Diagnosed Diabetes by Age and Sex (1998/99)
Trends in the prevalence of diabetes (1994 to 2002) Coefficient of determination (r2) = 0.974 Did you know that diabetes is the 7th leading cause of death in Canada!!!! This graph evidently displays the increase in the prevalence of diabetes over the years.
Mortality Rates due to Diabetes Estimated Future Deaths from Diabetes (Number of actual and projected deaths due to diabetes by sex, Canada, 1970 - 2050)
Part Three: Effects of Obesity on Diabetes (correlation between the two)
Observations and Conclusions based on Secondary Data • Obesity is an rapidly increasing health risk in Canadian society • Obesity and diabetes are directly correlated. • Obesity is a modifiable risk factor of diabetes • Diet and Physical Exercise prevent both diseases • Diabetes prevalence in Canada is on the rise. It is already the 7th leading cause of death. If it continues to increase it will produce a major health epidemic in our society.
How can we fix this fast approaching epidemic? What effect do Canadian’s knowledge, attitudes, and behaviors concerning obesity have on type two diabetes?
Surveyed 100 people • Objectives: • Obtain information to back up secondary sources • Explore my thesis and come to some concrete conclusions Section Four Analyzing Primary Source Data
Gender Response Frequency Gender Distribution of Survey Respondents 60 50 40 Frequency 30 20 10 0 Male Female Unknown Gender
Section Five Conclusion Data Sources and Limitations Bias
Conclusion Obesity rates in Canada are increasing rapidly. Why? Do Canadians not know about how to live a healthy life? Do they not care? Are they just choosing not to live a healthy life? 23% of the population is obese. Obesity has many serious health consequences, one being diabetes, which is directly correlated. Diabetes in Canada is on the rise as well. Diabetes is the 7th leading cause of death in Canada at the moment. If obesity leads to the development of type two diabetes then as obesity continues to rise so will the development of diabetes and ultimately more deaths.
Conclusion Continued After many hours of research and analysis of graphs I realized that the Canadian’s knowledge about obesity and its consequences is reasonably good and their attitude towards solving the problem and reducing obesity rates is good. Then why are obesity rates still so high. The reason is behavior. Canadians are not acting upon their knowledge and attitudes toward obesity. In my survey almost 80% of the people new the correct number of servings of fruit and vegetables you need per day but in the secondary source graph 80% were not eating the correct amount. In order to solve the rising epidemic I believe that the government should develop programs to encourage the behaviors of Canadians towards a healthy living in order to reduce obesity and thus reduce diabetes. Obesity is a modifiable risk factor for diabetes and stats show that an intensive healthy lifestyle (physical exercise) can reduce the risk of developing type two diabetes in an obese person by 58%. A person can reduce symptoms of diabetes through physical activity and proper diet. With obesity being a modifiable risk factor for diabetes, by improving Canadians behaviors towards obesity we can solve two major health issues as well as other benefits such as health care costs. If Canada could increase the number of physically active Canadians by 1% then the annual saving in the cost of treating type two diabetes would be $877,000. In conclusion obesity is a huge factor in reducing diabetes and in order to accomplish that the behaviors of Canadians need to be addressed because that is what the general population is lacking, not the knowledge, not the attitudes, but the behaviors.