Download
1 / 13
130 likes | 141 Vues
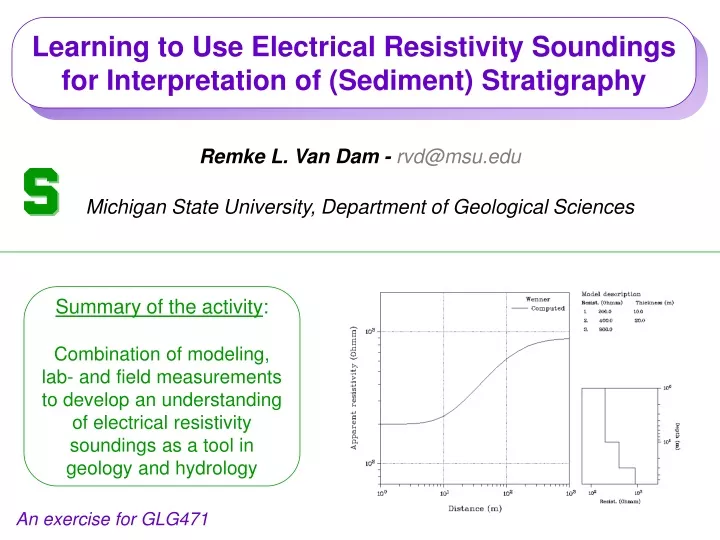
Learning to Use Electrical Resistivity Soundings for Interpretation of (Sediment) Stratigraphy. Remke L. Van Dam - rvd@msu.edu Michigan State University, Department of Geological Sciences. Summary of the activity :

E N D
Learning to Use Electrical Resistivity Soundings for Interpretation of (Sediment) Stratigraphy Remke L. Van Dam - rvd@msu.edu Michigan State University, Department of Geological Sciences Summary of the activity: Combination of modeling, lab- and field measurements to develop an understanding of electrical resistivity soundings as a tool in geology and hydrology An exercise for GLG471
Audience and Other Context Enrollment: 6-12 2006 4 Undergraduate students (3 seniors, 1 junior) 2 PhD students (hydrogeology) 2007 6 Undergraduate students (4 seniors, 2 juniors) 2 MSc students (1 hydrogeology; 1 sed/strat) Exercise is part of an Applied Geophysics course (GLG 471) • First exposure to geophysics for most students in • class. • Required / developed skills in the activity: • Current flow in layered media. • Good work ethic & collaboration skills. • Integrate different sources of data/information. • Reporting and presentation skills. Class grade buildup: 6 homeworks 30% Exam(s) 25-40% 3-4 Projects 30-45% Total project worth: 15-25% of total grade Lab reports (30%) Presentations (10%) Final report (60%)
Learning goals • Understand what influences bulk resistivity (for soils) • (soil texture, water saturation, temperature, soil salinity) • Learn to use basic software for forward modeling and data inversion • Plan a resistivity sounding • (based on available info from well logs, lab data and forward modeling exercise) • Interpret a field site in terms of stratigraphy and hydrology • (need to combine data from a several (inconclusive) sources) • Produce short but useful progress presentations and a final report
Activities and Tasks Sequence of potentially stand-alone projects and tasks (1 task / week). Students work in groups of two or three. Projects are integrated into one activity to have students participate in all steps towards successful application of a geophysical method: Intro & Planning Execution Data analysis Step (week)1: Intro to forward modeling and inversion of sounding data. Step (week)2: Laboratory estimation of Archie’s parameters. Step (week)3: Design of field sounding experiment. Step (week)4: Field data collection. Step (week)5: Data inversion and analysis. Step (week)6: Writing a Report. Weekly: Progress presentations
10’ 20’ 30’ 40’ 50’ MSU Sandhill Site(non-critical for exercise) DW38 37 20 DW9 DW8 Long-term ERT monitoring transect DW38 DW37 DW20 DW14 4: CSCG Used for hydrology, forestry research, and ERT. Glacial sediments, primarily clay with sand and gravel. Bedrock (sandstone/shale) of Saginaw Fm at ~18m. 3: SCS • Q: what are potential issues that with this site & exercise • A1: Significant lateral variation • A2: Is borehole stratigraphy accurate? 2: CB
Week 1: Fwd modeling, interpretation, inversion 2-layer: glacial drift over bedrock • Learning goals: • Current flow in layered media • Effects of θ, η, and T on ρa • Discuss limitations of resistivity • Get familiar with software (e.g., RES1D / DCINV / RESIST) 3-L: glacial drift over clay over bedrock 3-L: drift over saprolite over bedrock
Apparent resistivity (Ωm) AB/2 (m) Week 1: Fwd modeling, interpretation, inversion • Q: How many layers minimum? • A: 2 / 3 / 4 ?? • Q: One location, different readings. How? Why? • A1: Operational and equipment errors • A2: changes in field conditions
Week 1: Fwd modeling, interpretation, inversion “blind” three-layer inversion “assisted” three-layer model RMS=8.39% RMS=9.96% Layer 2: thickness = 40m ρ > 2000 Ωm Layer 2: thickness = 5m ρ > 13,000 Ωm • Ludington stratigraphy: • Local fine dune sand • 0-10m • Coarse glacial outwash • 30-50m • Proglacial clay • Q: Does an inversion produce the best solution? • Q: Can we say how many layers are present? • Q: Name different factors that influence data quality and inversion success.
0.02 0.1 0.3 Week 2: Lab-Estimation of Archie’s Parameters • Learning goals: • Understand relations between resistivity and texture, water saturation, temperature, and salinity. • Resistivity instrument operation. • Proper laboratory procedures. Each group measures relation between resistivity and other variables (θ, η, T, water salinity) for 2 samples. Need to measure geometry of test box to find resistivity in Ωm. Measurements will produce plot like to the right, which allows to obtain Archie’s parameters.
Week 3: Survey Design • Students will build stratigraphic models for two well logs, add resistivity values and calculate the expected sounding curves. • Based on the modeling results including uncertainly, students will design a field survey with maximum resolution & minimum redundancy. • Before heading out to the field have ready: • # of measurements • a-spacing values (or a and b) • Two-tape layout: ABMN positions for each measurement Important: Need to combine knowledge gained in weeks 1 and 2 for this week’s task.
Week 4: Data Collection We will use an AGI supersting R8/IP instrument for our sounding surveys. This task will take place in groups of four students, each conducting two sounding experiments. • Learning goals: • Equipment handling • Field procedures • Safety issues • Qualitative data interpretation Plotting and qualitative interpretation:
Week 5: Data inversion and interpretation • Learning goals: • Understand what factors influence inversion success. • Discuss which of these factors you can control. We will take different approaches and discuss the pro’s and con’s: • Use the expected resistivity responses (Week 3) as a starting point and invert the data. • Use your qualitative interpretation (Week 4) as a starting point and invert the data. • Let the software pick the number of layers and their resistivity values.
Week 6+: Writing a Report Report written in groups of 2 students.