Download
1 / 1
10 likes | 111 Vues
Temperature probe over alvinellids. Intensity of diffuse flow. Water depth (m). Water depth (m). Region 2. Northing (m). Region 3. Region 1. Water depth (m). Easting (m). Characterizing Diffuse Hydrothermal Flow in the Main Endeavour Field, Juan de Fuca Ridge.

E N D
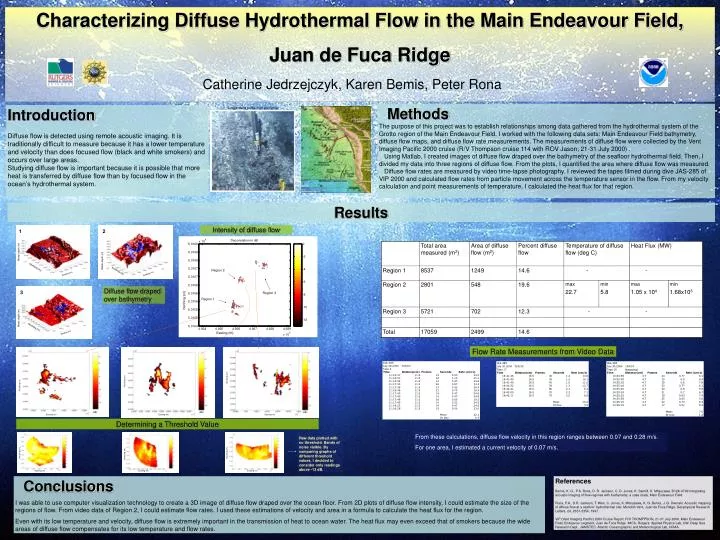
Temperature probe over alvinellids Intensity of diffuse flow Water depth (m) Water depth (m) Region 2 Northing (m) Region 3 Region 1 Water depth (m) Easting (m) Characterizing Diffuse Hydrothermal Flow in the Main Endeavour Field, Juan de Fuca Ridge Catherine Jedrzejczyk, Karen Bemis, Peter Rona Methods The purpose of this project was to establish relationships among data gathered from the hydrothermal system of the Grotto region of the Main Endeavour Field. I worked with the following data sets: Main Endeavour Field bathymetry, diffuse flow maps, and diffuse flow rate measurements. The measurements of diffuse flow were collected by the Vent Imaging Pacific 2000 cruise (R/V Thompson cruise 114 with ROV Jason; 21-31 July 2000) . Using Matlab, I created images of diffuse flow draped over the bathymetry of the seafloor hydrothermal field. Then, I divided my data into three regions of diffuse flow. From the plots, I quantified the area where diffuse flow was measured. Diffuse flow rates are measured by video time-lapse photography. I reviewed the tapes filmed during dive JAS-285 of VIP 2000 and calculated flow rates from particle movement across the temperature sensor in the flow. From my velocity calculation and point measurements of temperature, I calculated the heat flux for that region. Introduction Diffuse flow is detected using remote acoustic imaging. It is traditionally difficult to measure because it has a lower temperature and velocity than does focused flow (black and white smokers) and occurs over large areas. Studying diffuse flow is important because it is possible that more heat is transferred by diffuse flow than by focused flow in the ocean’s hydrothermal system. Results 1 2 Northing (m) Easting (m) Easting (m) Northing (m) Diffuse flow draped over bathymetry 3 Northing (m) Easting (m) Flow Rate Measurements from Video Data Northing (m) Northing (m) Northing (m) (dB) (dB) (dB) Easting (m) Easting (m) Easting (m) Determining a Threshold Value From these calculations, diffuse flow velocity in this region ranges between 0.07 and 0.28 m/s. For one area, I estimated a current velocity of 0.07 m/s. Raw data plotted with no threshold. Bands of noise visible. By comparing graphs of different threshold values, I decided to consider only readings above -13 dB. Northing (m) Northing (m) Northing (m) Easting (m) Easting (m) Easting (m) Conclusions I was able to use computer visualization technology to create a 3D image of diffuse flow draped over the ocean floor. From 2D plots of diffuse flow intensity, I could estimate the size of the regions of flow. From video data of Region 2, I could estimate flow rates. I used these estimations of velocity and area in a formula to calculate the heat flux for the region. Even with its low temperature and velocity, diffuse flow is extremely important in the transmission of heat to ocean water. The heat flux may even exceed that of smokers because the wide areas of diffuse flow compensates for its low temperature and flow rates. References Bemis, K. G., P.A. Rona, D. R. Jackson, C. D. Jones, K. Santilli, K. Mitsuzawa. B12A-0749 Integrating acoustic imaging of flow regimes with bathymetry: a case study, Main Endeavour Field. Rona, P.A., D.R. Jackson, T. Wen, C. Jones, K. Mitsuzawa, K. G. Bemis, J. G. Dworski. Acoustic mapping of diffuse flow at a seafloor hydrothermal site: Monolith Vent, Juan de Fuca Ridge. Geophysical Research Letters, 24, 2351-2354, 1997. VIP (Vent Imaging Pacific) 2000 Cruise Report. R/V THOMPPSON, 21-31 July 2000. Main Endeavour Field, Endeavour segment, Juan de Fuca Ridge. IMCS, Rutgers. Applied Physics Lab, UW. Deep Sea Research Dept.. JAMSTEC. Atlantic Oceanographic and Meteorological Lab, NOAA.