Download
1 / 61
610 likes | 719 Vues
X-ray Diagnostics and Their Relationship to Magnetic Fields. David Cohen Swarthmore College. X-rays in massive stars are associated with their radiation-driven winds. erg s -1. Power in these winds: . while the x-ray luminosity.

E N D
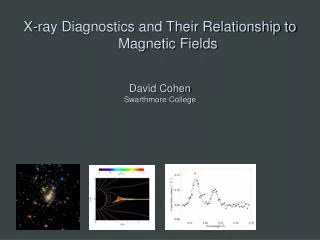
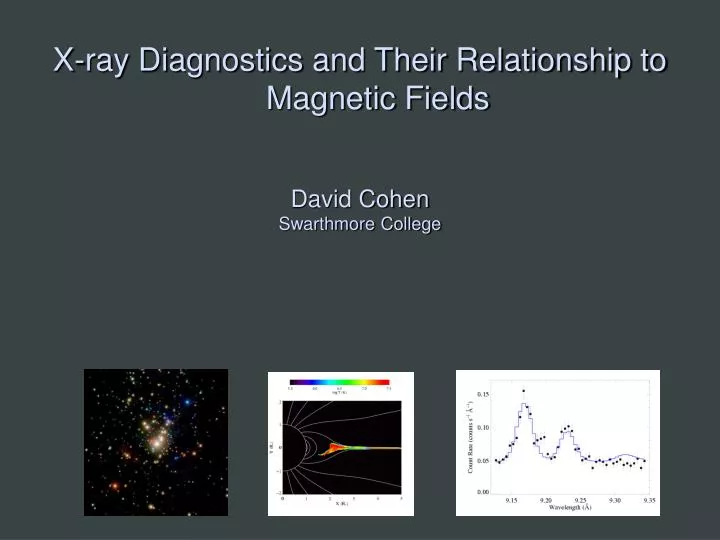
X-ray Diagnostics and Their Relationship to Magnetic Fields David CohenSwarthmore College
X-rays in massive stars are associated with their radiation-driven winds
erg s-1 Power in these winds: while the x-ray luminosity To account for the x-rays, only one part in 10-4of the wind’s mechanical power is needed to heat the wind
Three models for massive star x-ray emission 1. Instability driven shocks 2. Magnetically channeled wind shocks 3. Wind-wind interaction in close binaries
CEN1AB - Kleinmann’s Anonymous Star – is an O4+O4 binary system – with 1.8” separation
simulated Chandra grating spectrum Line ratios for location of the X-ray emitting plasma Line widths for the plasma kinematics
The Chandra X-ray Observatory started taken the data yesterday
The X-ray spectrum will tell us: Line ratios for location of the X-ray emitting plasma Line widths for the plasma kinematics
1 Ori C z Pup H-like/He-like ratio is temperature sensitive Mg XII Mg XI Si XIV Si XIII
1 Ori C z Pup 1Ori C – is hotter Mg XII Mg XI Si XIV Si XIII H/He > 1 in 1Ori C
Differential Emission Measure (temperature distribution) q1Ori C is much hotter Wojdowski & Schulz (2005)
q1 Ori C(O7 V) z Pup(O4 If) Emission lines are significantly narrower, too 1000 km s-1
Ne X Ly-a in q1Ori C : cooler plasma, broader – some contribution from “standard” instability wind shocks
The X-ray properties of q1 Ori C can be understood in the context of its magnetic field and the magnetically channeled wind shock (MCWS) mechanism
Dipole magnetic field Wade et al. 2008
Dynamical models (ud-Doula; Townsend): color scale shows emission measure in different temperature regimes astro.swarthmore.edu/~cohen/presentations/MiMeS2/zeus-movie.avi
Looking at individual physical variables: Note that the hot, post-shock plasma: • has relatively low density, • is concentrated near the tops of the largest closed-loop regions (~2Rstar), • and is very slow moving (due to confinement)
MHD simulation summary temperature emission measure Gagnéet al. (2005) Channeled collision is close to head-on:Dv > 1000 km s-1 : T > 107 K
Differential emission measure (temperature distribution) MHD simulation of 1Ori C reproduces the observed differential emission measure Wojdowski & Schulz (2005)
0.4 1.5 0.3 1.0 Simulation EM (1056 cm-3) 0.2 θ1 Ori C ACIS-I count rate (s-1) 0.5 0.1 0.0 0.0 0.0 0.2 0.4 0.6 0.8 1.0 Rotational phase (P=15.422 days) Chandra broadband count rate vs. rotational phase Model from MHD simulation
0.4 1.5 0.3 1.0 Simulation EM (1056 cm-3) 0.2 θ1 Ori C ACIS-I count rate (s-1) 0.5 0.1 0.0 0.0 0.0 0.2 0.4 0.6 0.8 1.0 Rotational phase (P=15.422 days) The star itself occults the hot plasma in the magnetosphere The closer the hot plasma is to the star, the deeper the dip in the x-ray light curve
0.4 1.5 0.3 1.0 Simulation EM (1056 cm-3) 0.2 θ1 Ori C ACIS-I count rate (s-1) 0.5 0.1 0.0 0.0 0.0 0.2 0.4 0.6 0.8 1.0 Rotational phase (P=15.422 days) The star itself occults the hot plasma in the magnetosphere hot plasma is too far from the star in the simulation – the dip is not deep enough
q1Ori C column density (from x-ray absorption) vs. phase pole-on equator-on
Emission measure contour encloses T > 106 K
Helium-like species’ forbidden-to-intercombination line ratios – f/i or z/(x+y) – provide information about the location of the hot plasma
Helium-like ions (e.g. O+6, Ne+8, Mg+10, Si+12, S+14) – schematic energy level diagram 1s2p 1P 10-20 eV 1s2p 3P 1s2s 3S resonance (w) forbidden (z) 1-2 keV intercombination (x+y) g.s. 1s21S
Ultraviolet light from the star’s photosphere drives photoexcitation out of the 3S level 1s2p 1P 1s2p 3P UV 1s2s 3S resonance (w) forbidden (z) intercombination (x+y) g.s. 1s21S
Weakening the forbidden line and strengthening the intercombination line 1s2p 1P 1s2p 3P UV 1s2s 3S resonance (w) forbidden (z) intercombination (x+y) g.s. 1s21S
The f/i ratio is thus a diagnostic of the local UV mean intensity… 1s2p 1P 1s2p 3P UV 1s2s 3S resonance (w) forbidden (z) intercombination (x+y) g.s. 1s21S
…and thus the distance of the x-ray emitting plasma from the photosphere 1s2p 1P 1s2p 3P UV 1s2s 3S resonance (w) forbidden (z) intercombination (x+y) g.s. 1s21S
1 Ori C Mg XI
Rfir=2.1 R* Rfir=1.2 R* Rfir=4.0 R*
He-like f/i ratios and the x-ray light curve both indicate that the hot plasma is somewhat closer to the photosphere of q1Ori C than the MHD models predict.
So, in q1Ori C, the X-rays tell us about the magnetospheric conditions in several ways: • High X-ray luminosity • X-ray hardness (high plasma temperatures) • Periodic variability (rotation and occultation) • Narrow emission lines (confinement) • f/i ratios quantify location
What about confinement? Recall: q1Ori C: h* ~ 20 : decent confinement
What about confinement? Recall: zOri: h* ~ 0.1 : poor confinement q1Ori C: h* ~ 20 : decent confinement sOri E: h* ~ 107 : excellent confinement
q1Ori C has a hard X-ray spectrum with narrow lines …HD191612 and zOri have soft X-ray spectra with broad lines -vinf lo +vinf Fe XVII in zOri
1Ori C zOri
tScodoes have a hard spectrum and narrow lines Ne Lya compared to instrumental response: narrow