Download
1 / 33
330 likes | 456 Vues
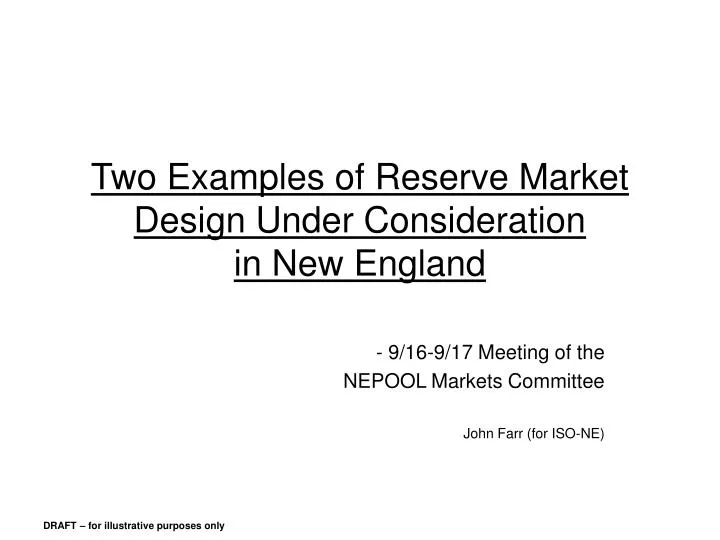
Two Examples of Reserve Market Design Under Consideration in New England. 9/16-9/17 Meeting of the NEPOOL Markets Committee John Farr (for ISO-NE). Illustrative Example 1: Constrained Sub-Area and Two Reserve Products. Illustrative Example 1: Reserve Requirements. Control Area Boundary.

E N D
Two Examples of Reserve Market Design Under Consideration in New England 9/16-9/17 Meeting of the NEPOOL Markets Committee John Farr (for ISO-NE)
Illustrative Example 1: Constrained Sub-Area and Two Reserve Products
Illustrative Example 1: Reserve Requirements Control Area Boundary Control AreaRequirements (Additional): Spinning = 200 MW (125 MW) Total = 400 MW (125 MW) Import Constrained Area Boundary Import Constrained AreaRequirements: Spinning = 75 MW Total = 150 MW (75 MW) • Control area has 400 MW total reserve requirement (spinning plus non-spinning), 200 MW of which must be spinning. • 150 MW of 400 MW total requirement must be in import constrained area, 75 MW of which must be spinning
Ability of Different Types of Resources to Serve Operating Requirements • Table shows ability of different types of resources to meet multiple requirements. • Resources will be able to serve whatever markets for which they are able to meet operating requirement.
Illustrative Example 1: Day-Ahead Market Clearing • Four units capable of providing reserves available in constrained area and ten total units available with bidding and cost characteristics shown above. • Example assumes co-optimization has already taken place. Only reserve capabilities are shown.
Illustrative Example1: Day-Ahead Market Clearing • Market clearing methodology • Each requirement is met based on lowest cost available resources • Spinning resources and resources in import constrained areas allowed to meet requirements for non-spinning reserves and for control area (i.e., “cascading”) • Prices for spinning reserves and reserves in import constrained area must be at least as high as non spinning reserves and prices for control area. • Following slides show bid stack for each product/location • Slides are for illustration purposes. Actual market could be cleared using linear programming or other method.
Illustrative Example1: Summary of All Resources Meeting Operating Requirements
Determining Clearing Prices Reserve Service • Value of reserve service equals the maximum marginal bid of resources designated as meeting requirements that are capable of providing that reserve service. • In this example, all resources needed to meeting spinning reserve requirement in the constrained area would have been used to meet the total reserve requirement. Spin requirement is not “binding” and should not be relevant to price.
Real-Time Market • ISO-NE proposes to price real-time reserves using “demand curves” • Demand curves would indicate the value of various reserve services as a function of the amount of reserve capacity available • Values based on “shadow value” of service implicit in ISO operational practices • Explicitly values violations of each operating constraint • ISO to ensure greatest possible consistency between pricing mechanism and operational practice.
Illustrative Demand Curve for Reserves Demand Reserve Price Supply1 Supply2 P1 P2 Q1 Q2 Reserve Capacity Available to Meet Single Operating Constraint
Demand Curve for Reserves • Provides means of pricing reserves in real-time. • Two conditions under which prices are set • Scarcity conditions (Supply Curve 1 from previous slide) • ISO unable to its reserve criteria either because reserves are unavailable or too expensive • Demand curve provides maximum value ISO would be willing to pay for reserves in order to protect reliability/load • At criterion conditions (Supply Curve 2 from previous slide) • ISO able to meet criteria but must incur redispatch or other cost in order to do so (e.g., resource is “postured” to provide reserves even though its energy bid is in-merit in the energy market • Reserves priced at cost of procurement (e.g., lost opportunity cost for resources “postured” to provide reserves
“Shadow Value” of Reserve Service • “Shadow Value” of reserves is the value of making available an increment of capacity that is capable of serving one or more operating reserve requirements • Is the sum of the values associated with individual operating requirements that the increment of reserve capacity can serve • Positive when reserve capacity is scarce (i.e., operating requirement is not fully met) or when economic capacity must be withheld from the energy market to provide reserves. • Zero when no scarcity exists (i.e., operating requirements fully met without redispatch costs)
Demand Curves and Operational Practice • ISO actions taken to restore or create reserves may come at significant cost, for example: • Posturing of resources • Commitment of otherwise out-of-merit resources • Scheduling of imports • ISO should not take actions to restore reserves at costs that exceed prices indicated on curves. • Perfect consistency not possible • “Lumpiness” of resources • Uncertainty resulting from time-delay between action and real time (e.g., unit commitment decisions due to start-up times) • ISO to seek to ensure greatest possible consistency
“Shadow Value” of Reserve Service Shadow Value of Value of Meeting Reserve ServiceOperating Constraint(s) • CA-NS =CA-Ttl • CA-Synch =CA-Ttl + CA-Spin • IC-NS =CA-Ttl + IC-Ttl • IC-Synch =CA-Ttl + CA-Spin + IC-Ttl + IC-Spin • Value of meeting individual operating constraints may be zero or positive • By definition, reserve values reflect relative value of service (e.g., CA-NS can not be greater than CA-Synch)
Illustrative Example 1: Real-Time Market Clearing • Four separate demand curves used to provide values for CA-Ttl, CA-Spin, IC-Ttl, andIC-Spin • Based on real-time levels of capacity available to meet these operating constraints, assume curve indicates values*: CA-Ttl = $5/MWH CA-Spin = $0/MWH IC-Ttl = $0/MWH IC-Spin = $60/MWH • Solving for prices: CA-NS = $5= $5/MWH CA-Synch = $5 + $0 = $5/MWH IC-NS = $5 + $0 = $5/MWH IC-Synch = $5 + $0 + $0 + $60 = $65/MWH * - For example, assume $5/MWH redispatch cost exists to meet control area total reserve requirement and the demand curve indicates a value of $60/MWH for synchronized in the constrained area due to scarcity.
Illustrative Example 2: Interactions Between Forward, Day-Ahead, and Real-Time Reserve Market
Relationship Between Forward Market and Day-Ahead and Real-Time Markets • Upon implementation of the day-ahead and real-time market, the forward market will provide a longer-term mechanism for trading and hedging real-time reserve obligations. • Supply selling into forward market has obligation to provide reserves in real-time, or to purchase them (i.e., “financially binding”) • Optional participation by those with obligation • Optional participation by those with assets • Supply not limited to physical assets • Supply selling into forward market has no additional obligations to bid in any particular manner (unlike the current forward reserve market)
Relationship Between Day-Ahead, and Real-Time Markets (Questions Bolded, Ex. 2 Assumptions in Bolded Italics) • Like the day-ahead energy market, the day-ahead reserve market will identify expected reserve resources, create a financial obligation for those resources to provide reserves, and provide a means through which most participants with real-time reserve obligations are likely to cover that obligation. • Will purchase/bidding be optional or obligatory for those with obligation? Will those with obligation bid willingness to pay?Example 2 assumes participation is optional w/ resource adequacy guaranteed by RAA process (as with energy) • Willsale/bidding be optional or obligatory for those with physical assets? Example 2 assumes that ICAP resources be obligated to bid in manner parallel to energy market. • The real-time reserve market will identify the resources that physically provided reserves and ensure that all participants meet their physical and financial obligations. • Will real-time market also determine final reserve obligation? Example assumes that final reserve obligation should depend on real-time requirements and real-time supply conditions (e.g., will be reduced in OP4 conditions) • Obligatory purchase by those with obligation • Supply determined by those actually providing service • No bidding by supply or demand • Prices determined using demand curves and lost opportunity cost
Illustrative Example 2: Resources and Obligations • Six participants have the these expected positions. • Supply positions are expected, based on characteristics of their assets and expected use in the energy market • Obligations are expected based on a fixed, but yet undefined method for allocating reserve obligations • Like energy, final supply and obligations will be based on real-time conditions.
Illustrative Example 2: Forward Reserve Market After Implementation of Spot Reserve Markets
Illustrative Example 2: Forward Reserve Market After Implementation of Spot Reserve Markets • 220 MWs of forward reserves clear at a price of $4/MWH • Table shows how each participants position is changed by forward auction. A few things to note: • 220 of 300 MWs of expected obligation purchased in forward auction • An excess of 150 MW of reserves are expected to exist • Mike has sold forward without any physical asset to back up his sale • Fred has more than covered his expected obligation
Illustrative Example 2: Day-Ahead Reserve Market • 85 MWs of day-ahead reserves clear at a price of $3/MWH • Table shows how each participants position is changed by day-ahead auction. A few things to note: • John is only participant with remaining obligation • Mike still has to buy back the 20 MW he sold forward as he has no physical assets to fill his position • Betsy still has all her capacity (has not sold anything)
Illustrative Example 2: Real-Time Reserve Market • In real-time John is only able to supply 20 MW’s of reserves. 180 MWs less reserves is available than expected • Scarcity condition exists as ISO is unable to meet its real-time criterion. Reserve price is $15 based on the 270 MW of reserves actually available in real-time. • John is unable to cover his forward and day-ahead sales with bilateral purchases because of the outage and must buy 185 MW of reserves at real-time prices. • Betsy sells all of her reserves in real-time market. • All other participants settle their relatively small real-time positions • e.g., Mary has sold forward and does not participate in real-time market • e.g., Mike has to buy back 20 MW at loss
Illustrative Example 2: Participant Settlement for Forward, Day-Ahead, and Real-Time Reserve Markets
Illustrative Example 2: Participant Settlement for Forward, Day-Ahead, and Real-Time Reserve Markets
Illustrative Example 2: Participant Settlement for Forward, Day-Ahead, and Real-Time Reserve Markets
Illustrative Example 2: Participant Settlement for Forward, Day-Ahead, and Real-Time Reserve Markets
Illustrative Example 2: Participant Settlement for Forward, Day-Ahead, and Real-Time Reserve Markets
Illustrative Example 2: Participant Settlement for Forward, Day-Ahead, and Real-Time Reserve Markets