Download
1 / 33
350 likes | 675 Vues
Denials Management: A Case Study. Patricia Kroken, FACMPE, CRA Jennifer Kroken, MBA Imagine Users Meeting 2010 Charlotte, NC. Hospital-based case study. Radiology Consultants of North Dallas 17 radiologists Primarily hospital-based Also read at numerous imaging centers

E N D
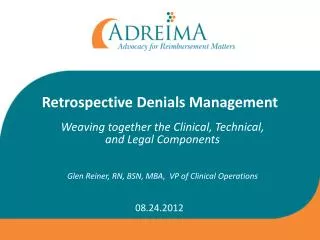
Denials Management:A Case Study Patricia Kroken, FACMPE, CRA Jennifer Kroken, MBA Imagine Users Meeting 2010 Charlotte, NC
Hospital-based case study • Radiology Consultants of North Dallas • 17 radiologists • Primarily hospital-based • Also read at numerous imaging centers • 13.5 billing/collections staff • ImagineRadiology installed 2004 • “Denial” = claim denied for payment on first pass • May eventually be paid
Research • Very little published data to support development of baseline comparison or benchmark • General consensus 15-30% denial rates • Not radiology-specific • Anecdotal: 15% in radiology “not bad”
Denials management • Goals • Reduce first pass denials by identifying and correcting root causes • Improve follow-up processes for denied claims • Identify compliance risks • Denials management does not just involve sending appeal letters
Six Sigma • Developed by Motorola • Measured error rates for manufacturing processes • Established framework for breakthrough process improvement • Utilizes a series of defined steps that can be continuously repeated until a process is maximized
Radiology Billing is Process-Driven Demographics Charge Entry Claims Submission Matched Coding Radiology Reports Secondary ins Payment Patient co-pay Insurance Follow-up Self pay • Correspondence • Denial • No activity • Payment plan • Payment • File insurance Payment Research Collection Agency Bad debt write-off Re-file Small balance write-off
DMAIC for Denials Project • Define • Denied claims represent an opportunity to improve profitability • Processes surrounding claims submission and follow-up appear to be inefficient • Measure • Categories of denied claims
DMAIC for Denials Project • Analyze • Processes in place for claims preparation, submissions and follow-up • Potential risk and/or gains from addressing certain denial categories • Root causes of why denials are occurring • Improve • Implement technology to eliminate manual processes and standardize • Train those involved regarding standardized processes • Change workflow and transition to paperless environment
DMAIC for Denials Project • Control • Verify standardization of denials management processes • Continue to measure to ensure replication of results • Define—circular process starts again
Logic and Organization • Compliance denials • Practice potentially placed at risk • Could be in violation of regulations • Coding (including bundling/unbundling) • Medical necessity • Duplicate claims • Administrative • Usually due to process error or omission • Theoretically preventable • Eligibility • Missing/incorrect information • Prior authorization • Timely filing • Non-covered service • Denied—no reason given
Condense Categories • Use general areas identified under compliance and administrative categories • Denial categories set up in system maintenance • Insurance company variations assigned to categories by payment poster posting denials • Note: also found to improve payment posting production when compared to using hundreds of insurance company categories • EOBs/denials scanned into system and accessible from workstations • Removes objection of having to see insurance denial reason
Comments: Total Denials • Baseline in 2004: 10% denials rate • Aggressive editing software had already improved the percentage to some degree at the time the project started • In some cases improvement in one category might be offset by increases in another • Changes in Medicare LCDs or payor edits • Payor computer problems (BCBS in early 2009) • Consistent improvement annually to 6% 2009
Comments: Coding Denials • Coding denials 2004: 4.26% of all procedures • 42.6% of denials • Represented a potential compliance risk • Financial plus risk management priority • From 2006-present: fewer than 1% of all procedures denied for coding issues • 2009 denial rate .41% of total or 7% of denied procedures
Coding: Root Cause Corrections • Physician dictation • Often a cause for inaccurate or under-coding problems • Review of dictation patterns identified issues • Physician leadership supported educational and “enforcement” efforts • Reports compared to objective resource • ACR Communications Guidelines
Coding: Root Cause Corrections • Physician education • Discussion of coding basics • History/reason for exam • Number of views • Separate paragraphs for complex studies • Example: CT of chest, abdomen and pelvis • Complete/limited ultrasound dictation elements • If it isn’t dictated, it didn’t happen • No assumption coding or “protocol”
Coding: Root Cause Corrections • Custom workbooks by physician • ACR Communication Guideline • How physician’s reports compared to ACR parameters • Indication/reason for study • Views, contrast, limited/complete study • Impression • Samples of that physician’s problematic reports • Difficult to code • Would have to be down-coded • Difficult to appeal based on available documentation • Samples of “good” reports containing all elements
Coding: Root Cause Corrections • Temporarily: administrative employee at hospital reviewed reports daily • Returned those without histories, views, etc. for re-dictation • Physician leadership reinforced the program! • Ongoing: feedback and/or updates • Changes in dictation requirements for complete vs. limited ultrasound studies • Problems and/or trends
Comments: Medical Necessity Denials • Consistently less than 1% of total procedures • Less improvement year-to-year • Changes in LCDs • PET • Vascular procedures • Vertebroplasty/kyphoplasty • Improvements in coding documentation supported medical necessity • Denied claims did not show deficiency in dictation but still denied
Comments: Eligibility • Administrative denial • Usually human error • Controllable in imaging center setting, but not hospital-based • Solution • Use available technology • Front-end editing • Value-added clearinghouse with automated eligibility checks
Comments: Eligibility • Industry: 45% of denials due to eligibility • Clearinghouse database: 29% of claims denied for eligibility • RCND 2004: less than 1% denial rate • Eligibility denials rose 2007-2008 • Value-added clearinghouse added end of 2008 • Eligibility dropped nearly 50% 2008-2009 • Checks eligibility for 200+ health plans
Comments: Eligibility • 2008-2009 dramatic gains in top payors • BCBS experienced internal computer issues in early 2009 so improvement less dramatic • Substantial gains • Medicare • Medicaid • United Healthcare
Comments: Timely Filing • Timely filing 2004: 2.2% of total claims • Impacted by conversion to new software • Staff member resistance to changing systems = “former employee” • United Healthcare impacted • Timely filing 2009: .06% of total claims • .01% of total denials • Approximately 11 days from DOS to claim release
Discussion and Conclusions • Root cause corrections reduce denials • Higher number of clean claims = less work on the back end and faster cash flow • Hospital-based practices will have a higher rate of administrative denials • No control over data gathering processes • High-turnover positions • Lack of experience/education • Imaging centers should theoretically be able to eliminate administrative
Prioritizing the Program • Medical necessity • Frequently high dollar procedures • Both financial and compliance risk • Coding • Physician education/behavior modification efforts pay off quickly • Coder education/certification emphasis • Eligibility • Use available technology!
Final Thoughts • Technology is critical and available • You can’t manage what you can’t measure • Need high volume processing—can’t be done manually • Billing and collections activities involve a series of defined processes • Determine where problems originate • Reduce variability in processes and improve results • As one process stabilizes and demonstrates control, move to the next
Thanks! Pat Kroken, Albuquerque, NM 505-856-6128 pkroken@comcast.net Jennifer Kroken, Dallas, TX 817-403-3355 jkroken@radconsultants.com Healthcare Resource Providers P.O. Box 90190 Albuquerque, NM 87199