Download
1 / 21
210 likes | 214 Vues
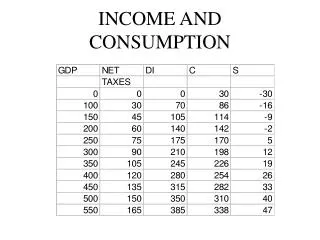
Explore the results of consumption and labor income profiles across countries, including factors that contribute to variations. Preliminary findings for National Transfer Accounts are presented, displaying trends in consumption and labor income.

E N D
Consumption and Labor Income Profiles: Results Sang-Hyop Lee University of Hawaii at Manoa National Transfer Accounts
Outline • Results for Consumption (from An-Chi) • Results for Labor Income • Why do they differ across countries? • Time-series Results National Transfer Accounts
Attention • All results are preliminary • Sources of estimation are suppressed • Not for citation • Per capita values are divided by average per capita earnings of people ages 30-49 for comparison (normalized) National Transfer Accounts
Consumption: Single Hump National Transfer Accounts
Double Hump National Transfer Accounts
Flat for Adults and Old Ages National Transfer Accounts
Rising at Old Age National Transfer Accounts
Labor Income: Thick Flat Tails National Transfer Accounts
Steep at Old Ages National Transfer Accounts
Steep atEarly Ages National Transfer Accounts
Start late, exit late National Transfer Accounts
Why Differ across Countries? National Transfer Accounts
Consumption • Income level matters • C on elderly is high in rich countries, and is mostly due to medical expenditures • C on children is low in low-income countries • Public vs. Private C • Richer countries have larger public consumption expenditures, on both health and education. • Data problems • CFD (durable) and CFR (housing) are not calculated in all economies • NTA methods to allocate to individuals National Transfer Accounts
Labor Income • Per capita labor income profile depends on several things. • Richer countries have low LFPRs for children and elderly • Richer countries have low share of self-employment income. • Old age productivity varies across countries. • Institution (legal age of work, mandatory schooling, minimum wage, seniority-based wage system) matters. • Data problems • Measurement of self-employment income National Transfer Accounts
Time-series and Cohort National Transfer Accounts
Consumption, Taiwan, 1981-2003 National Transfer Accounts
Labor Income, Taiwan 1977-2003 National Transfer Accounts
Acknowledgement Support for this project has been provided by the following institutions: • the John D. and Catherine T. MacArthur Foundation; • the National Institute on Aging: NIA, R37-AG025488 and NIA, R01-AG025247; • the International Development Research Centre (IDRC); • the United Nations Population Fund (UNFPA); • the Academic Frontier Project for Private Universities: matching fund subsidy from MEXT (Ministry of Education, Culture, Sports, Science and Technology), 2006-10, granted to the Nihon University Population Research Institute. National Transfer Accounts
The End National Transfer Accounts