Download
1 / 19
190 likes | 439 Vues
Warm-up A. P Stats - 3.5 Shape-Changing Transformations/ Stats – 3.4 Diagonstics. Copy the two columns and match them. A.P. Stats 3.4 Diagnostics – Looking at Influential Points. y-hat = 1.58x + 10.5 r = 0.769. Using the original data, enter into L1 and L2.

E N D
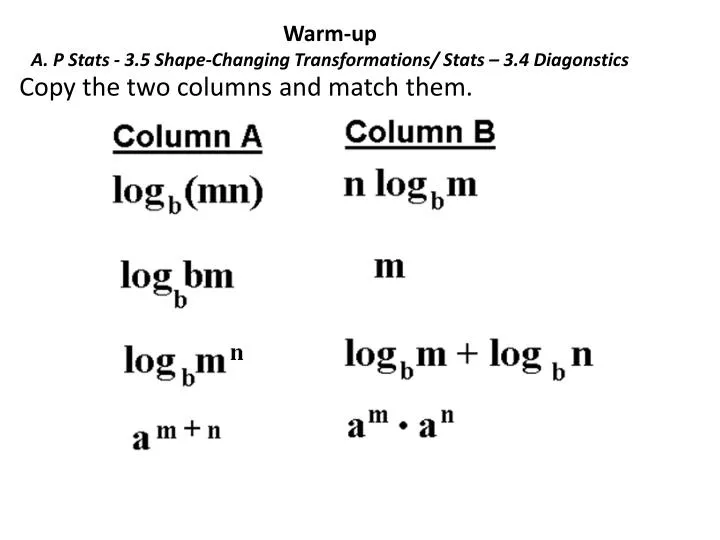
Warm-upA. P Stats - 3.5 Shape-Changing Transformations/ Stats – 3.4 Diagonstics Copy the two columns and match them.
A.P. Stats 3.4 Diagnostics – Looking at Influential Points y-hat =1.58x + 10.5 r = 0.769 Using the original data, enter into L1 and L2. Remove the beaver point (outlier in y) Remove the hippo point (outlier in x) How did removing the beaver affect the data? Removing the beaver data increased slope and decreased the y-intercept. The correlation coefficient increased. How did removing the hippo affect the data? Removing the hippo data changes slope and the y-intercept. Correlation increased slightly less than removing beaver. y-hat = 1.69x + 8.14 r =0.828 • y-hat = 1.96x + 6.3 • r = 0.8
A.P. Statistics Linear Regression Wksheet answers continued…
A.P. Stats – D 28 Exploration Sit in groups of 4, where everyone has a graphing calculator. Each person graphs a data set. Make a sketch of each. Compare graphs, THEN calculate LineReg L1,L2, Y1 Compare the graphs with the scatterplots and the regression line drawn.
A. P Statistics - 3.5 Shape-changing transformations Some functions are not linear. Complete the Coin Flipper activity. (pg 180) Flip the coins.(tails means they die, so remove them) Count them and write the number each time in the table. Keep on flipping until there are none left. Once you finish filling in the table and flippling Answer #4 – 5 on pg 180.
A. P. Statistics - Verifying a y=abx function Enter your data into L1 and L2 Stat-> Calc down to Exp Reg If b > 1, then b - 1 gives the growth rate. If 1< b < -1, then b – 1 is negative and gives the decay rate. One way to check if your function is really an exponential function is to linearize it . Keep the L1, but then change all L2 to logs in L3 . LineReg L1, L3, Y1 The data should look for linear. Look at the residual plot.
A. P. Statistics Linearizing continued… When rewriting the y was log(y) The equation becomes : log y = log a + (log b)x Power Relationships y = axb - In this case both y and x have to be redone as logs so it can be linearized. The new linearized equation is log y = ab log x
Stats 3.4 Diagnostics – Looking at Influential Points **** Put the points on the scatterplot first!! Using the original data, enter into L1 and L2. Remove the beaver point (outlier in y) Remove the hippo point (outlier in x) How did removing the beaver affect the data? How did removing the hippo affect the data? y-hat = r = y-hat = r = • y-hat = • r =
Stats – D 28 Exploration Sit in groups of 4, where everyone has a graphing calculator. Each person graphs a data set. Make a sketch of each. Compare graphs, THEN calculate LineReg L1,L2, Y1 Compare the graphs with the scatterplots and the regression line drawn.
Statistics Directions for Vocabulary/Formula Quiz • Complete the quiz quietly. • When you are done start graphing the information in the table for 3.4 notes on graph paper. (Skip cheetah-it has missing info) • Label the points for the beaver and hippo clearly. • Follow the directions on the notes and when everyone is done with the quiz we will review the answers.
Homework Assignment A.P. Statistics Section 3.4 E #43, 44, and 45 43 a and 45 b require you to construct a graph. I expect to see these in drawn in your h.w. answers Statistics Read and define terms in 3.4 Section 3.4 E # 43 and 44 All classes bring notes ready for notebook check.
Vocabulary for Ch. 3 Notebook Check Have these and the corresponding notes with warm-ups ready next block for notebook check 3.1 – scatterplot, bivariate, linearity, clusters, outliers, trend, strength, generalization 3.2 – slope, y-intercept, predictor (explanatory variable), predicted (response variable), residual, interpolation, extrapolation, prediction error, least squares regression line (regression line), sum of squared errors (SSE) 3.3 – correlation, regression toward the mean, line of means, regression effect, regression toward the mean 3.4 – potentially influential, residual plot 3.5 - exponential relationship, power relationships, power transformation 25 pts for vocabulary (# them 1 – 25) 6 notes w/ warm-ups (12 pts each = 4 pts warm-up + 8 pts for Notes) = 72pts 25 for vocab. + 72 for notes w/ warmups = 97 close enough to 100