Download
1 / 18
180 likes | 477 Vues
Covariance and Correlation. Questions: What does it mean to say that two variables are associated with one another? How can we mathematically formalize the concept of association? . The Concept of Bivariate Association.

E N D
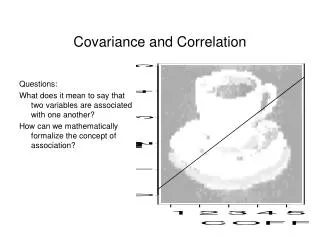
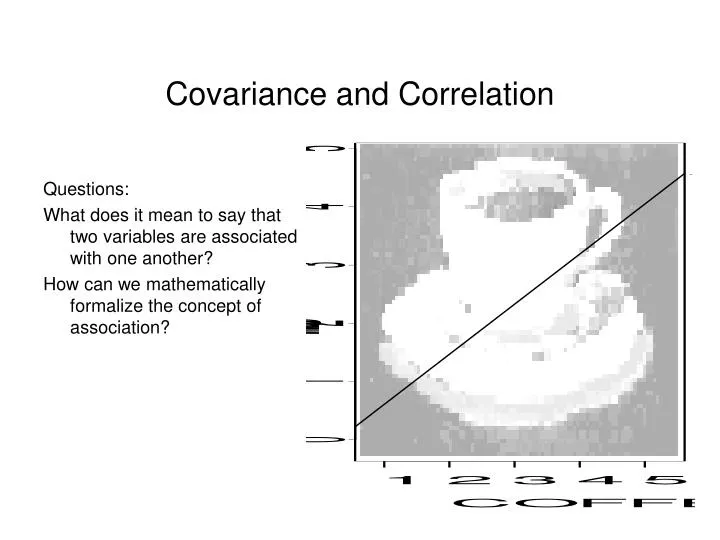
Covariance and Correlation Questions: What does it mean to say that two variables are associated with one another? How can we mathematically formalize the concept of association?
The Concept of Bivariate Association • Up to this point, we have focused on single variables, and describing their shape, their central tendency, and their dispersion. • What is the infant homicide rate? • Now that we’ve covered some of these basics, we’re ready to discuss one of the fundamental kinds of questions asked in psychology: How do two variables relate to one another? • Is there an association between the infant homicide rate of a nation and the degree to which teachers of that nation endorse corporal punishment?
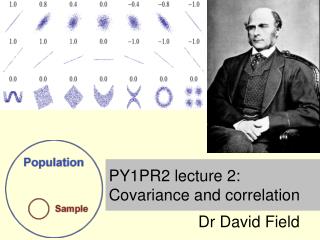
The Concept of Bivariate Association • The more a nation’s teachers approve of corporal punishment, the higher its infant homicide rate • from Straus, M. A. (1994). Beating the devil out of them: Corporal punishment in American families. San Francisco, CA: Jossey-Bass. • scatterplot
The Concept of Bivariate Association • Question: How can we quantify the association between two variables?
How do people’s scores on one variable vary as a function of another variable? x y [A] 9.75 9.56 [B] 7.72 7.81 [C] 10.84 10.30 [D] 9.37 8.57 [E] 10.04 10.22 [F] 10.94 11.15
People with high scores on x seem to have high scores on y x y [A] 9.75 9.56 [B] 7.72 7.81 [C] 10.84 10.30 [D] 9.37 8.57 [E] 10.04 10.22 [F] 10.94 11.15 Can we define what we mean by “high scores” more precisely?
yes. we can study deviations from the mean (X – Mx) and (Y – My) xd yd [A] -0.03 -0.04 [B] -2.06 -1.79 [C] 1.07 0.70 [D] -0.40 -1.03 [E] 0.26 0.62 [F] 1.16 1.55 now we can ask whether people who are above the mean (i.e., “high” on x) are above the mean on y
One way to do this is to tally the matches. People who are above the mean on X should be above the mean on Y. People who are below the mean on X should be below the mean on Y. xd yd [A] -0.03 -0.04 both below [B] -2.06 -1.79 both below [C] 1.07 0.70 both above [D] -0.40 -1.03 both below [E] 0.26 0.62 both above [F] 1.16 1.55 both above 100% match
If we resort some of the numbers, note what happens. Now E, C, B, & D show the same pattern on the two variables, but persons A & F do not. 4/6 (66%) show the matching pattern.
One limitation of counting the number of matches is that there are clearly different magnitudes of association that would count as perfect matches.
A more precise way to study the association is to multiply each person’s deviations together. Advantage: when there is a match (both + or both -), the product will be +. When there is a mismatch (one + and other -), the product will be -. xd yd (xd*yd) [A] -0.03 -0.04 0.00 [B] -2.06 -1.79 3.69 [C] 1.07 0.70 0.75 [D] -0.40 -1.03 0.41 [E] 0.26 0.62 0.16 [E] 1.16 1.55 1.80
Further, we can now inquire about the average product of deviation scores. The average of these products will tell us whether the typical person has the same signed deviation score on the two variables. xd yd (xd*yd) [A] -0.03 -0.04 0.00 [B] -2.06 -1.79 3.69 [C] 1.07 0.70 0.75 [D] -0.40 -1.03 0.41 [E] 0.26 0.62 0.16 [E] 1.16 1.55 1.80
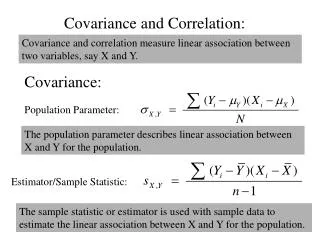
Covariance • This particular way of quantifying the association is called the covariance. • In short, we are seeking to determine the correspondence between the average person’s deviation scores on two variables—the extent to which those deviation scores vary together (i.e., covary).
Covariance • When this average product is positive, we say the two variables covary positively: people who are high on one variable tend to be high on the other • When this average product is negative, we say the two variables negatively covary together: people who are high on one variable tend to be low on the other • When this average product is zero, we say the two variables do not covary together. People who are high on one variable are just as likely to be high on the other as they are to be low on the other.
These two variables positively covary • People who drink a lot of coffee tend to be happy, and people who do not tend to be unhappy • Preview: The line is called a regression line, and represents the estimated linear relationship between the two variables. Notice that the slope of the line is positive in this example.
In this example, the two variables covary negatively • People high on x tend to be low on y • The regression line has a negative slope
In this example, there is no covariance between the two variables • People who are high on x are just as likely to be high on y as they are low on y • The regression line is flat