Download
1 / 48
480 likes | 627 Vues
CHANGES IN EAST ASIAN WINTER ATMOSPHERIC CIRCULATION. WU, M C YEUNG, K H LEUNG, Y K. We attempt to find out. If there has been any change in the East Asian winter ( December-February ) atmospheric circulation in the last several decades ( 1958-2005 )?

E N D
CHANGES IN EAST ASIAN WINTER ATMOSPHERIC CIRCULATION WU, M C YEUNG, K H LEUNG, Y K
We attempt to find out • If there has been any change in the East Asian winter (December-February) atmospheric circulation in the last several decades (1958-2005)? • Trends of the characteristics of its major components? • their possible influences to Hong Kong’s winter temperature • Changes in the interrelationships among the components? • Influences of some dominate climate patterns, namely the Arctic Oscillation (AO) and the Pacific Decadal Oscillation (PDO)?
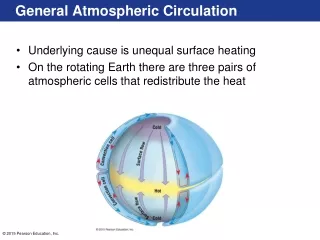
Overall Changes in Northern Hemisphere (NH) winter +- Linear trend (1958-2005) - ve + ve Weakening of N-S SLP gradient therefore a weakening of the East Asian winter monsoon there should also be some changes in the circulation against the background of global warming
EMT WMI ALPI SMH EAW SH_ISH_WSH_R EAT JET 8 major components Mid-troposphere (500 hPa) Aloft (200 hPa) Index: Lower troposphere (surface, 1000 hPa)
Trend/stdev Trend (/decade) Trend/stdev 1234 567 0.47 0.53 0.22 0.34 0.31 0.33 0.35 0.23 0.51 1.67 1.32 0.64 1.72 3.65 0.44 6.06 0.04 1.28 0.47 0.53 0.22 0.34 0.31 0.33 0.35 0.23 0.51 To compare the trends of different indicesConvert the trends to a common scale expressed in terms of a fraction of the standard deviation Significant trends (at 5% level) are found in the indices of the 7 components in the lower and mid-troposphere a remarkable change in the East Asian winter atmospheric circulation No significant trend is noted in the strength of the subtropical jet aloft • Magnitude of trend is obtained by Sen’s slope Trends in the components? The most prominent trend in lower troposphere is the weakening of the Siberia-Mongolia high whereas in mid-troposphere, it is the eastwards shift of the East Asian trough • Mann-Kendall test is used to test the significance of trend in the time series of these indices
Time series of SMH and EAT Strength of the Siberia-Mongolia High Decrease in strength Longitudinal position of the East Asian Trough Shift eastward Strength (hPa) Longitude (oE)
+ the difference in HK’s winter temperature between the 10 highest values and 10 lowest values of an index, from which the expected change in HK’s winter temperature accompanied with the trend of the index will be inferred The influences of the Aleutian low and the equatorial monsoon trough are apparently slight as the difference in HK's winter temperature for large and small values of ALPI and of EMT are statistically not significant with the exception of the intensifying Aleutian low, the trends of all indices are found to be consistent with a warmer winter in Hong Kong the trend of the index would likely to bring a warmer winter to HK *:the difference is significant at the 5% level. Change in Hong Kong’s winter temperature accompanied with the trends The significance of the difference is tested using the KS test The change in HK should be similar to that in southern China
reflect if there any change in the covariability between lower latitudes and mid-latitude circulation Lower latitudes Mid-latitude Any change in covariability? • Temporal variation in the relationship (correlation) between any two indices in the mid-troposphere • Moving correlation analysis with a 29-year sliding window is used • Spearman’s rank correlation
(between the westerlies and the ridge position) (between the westerlies and western position) (between the westerlies and subtropical high intensity) Correlation coefficient 0.6 1% significant level Significant Significant Significant 0.4 Correlation in the period (1958-1987) Correlation in the period (1959-1988) 5% significant level 0.2 Insignificant Insignificant Insignificant EAW vs SH_I (intensity) EAW vs SH_R (ridge-line position) 0 1973 1975 1977 1979 1981 1983 1985 1987 1989 1991 EAW vs SH_W (western position) Moving correlation analysis
Moving correlation analysis(between the intensity & western position of subtropical high) 1 % significant level 5 % significant level Therefore, • The degree of correlations between the Westerlies and the three subtropical high indices are declining • Indicates a decreasing covariability between lower latitudes circulation and mid-latitude circulation • On the other hand the interrelationships among the subtropical high indices are ratherl robust • for example,
Schematic diagram showing the interrelationships among the components of the winter atmospheric circulation in mid-troposphere Another indication of the change in the East Asian winter atmospheric circulation in the last several decades Decline in correlation from significant to insigificant Significant correlation Lower latitudescirculation
Winter temperature warmest coldest year 1985,1972, 1969…… .. 1963 rank according to the detrended NH winter temperature increase in the detrended NH winter temperature Series A Series B Runs-testsuggests this sequence is random (p-value= 0.38) in terms of YEAR 29 years selected as colder group (Group C) 29 years selected as warmer group (Group W) Correlation between series A and B for Group W Correlation between series A and B for Group C Question Detrend ALL time series (NH winter temperature, EAW, SH_I, etc) • Could the decline in covariability observed be related to global warming in terms of the rising trend of NH winter temperature? e.g. EAWe.g. SH_I The purpose of detrending is to ensure that one looks at the relationship between temperature and the index, not just the time variation of the index in view of the increase in temperature with time under global warming
Decline in correlation Comparison of the correlations between Group C and Group W * Correlation significant at 1% level. With a warmer NH winter, a decline in the correlation between the Westerlies and the subtropical high indices is suggested(most clear for the intensity and western position of the subtropical high)
Randomly select 29 pairs of EAW and SH_I Repeat 10,000 times Correlation for the 29 pairs 10,000 correlation Distribution of correlation How significant the relation between NH winter temperature and the change in covariabiltiy is? Detrend time series of EAW and SH_I Consider the covariability between the Westerlies (EAW) and the Subtropical high intensity (SH_I)as an example
Distribution of correlation <5.4% <3.1% % (out of 10,000 samples) the relationship between the covariability and NH winter temperature could be rather pronounced Rank correlation between detrended EAW and SH_I
Influences by some dominant modes of oscillation? • PDO, AO • Cumulative summation (CUSUM) • defined as the accumulating sum of anomalies (from the overall mean) of all preceding values. • aid to locate, in a qualitative sense, the change points in a time series • to see whether changes tend to match up across indices
1976 PDO 1988 PDO change phase by mid-1970s AO change phase by mid- to late1980s ENSO varies according to the background of PDO AO Nino 3.4 SST CUSUM charts for PDO & AO
Western-position Changes coincide with the climatic shift in the PDO in the mid-1970s can be located CUSUM charts for Subtropical High Ridge-line position Intensity
AO Changes are noted in the westerlies and trough position by mid- to late 1980s ~concurrent with the phase change in AO CUSUM charts for mid-latitude’s components Eurasian Westerlies (EAW) East Asian Trough position (EAT)
Therefore • Changes in the East Asian winter atmospheric circulation (in terms of the changes in EAW, EAT, SH_I etc) could also be a manifestation of some natural climate variability (if AO and PDO as natural oscillation) • Subtropical high is more strongly influenced by PDO • Components in mid-latitude are likely to be influenced by AO
Conclusion Changes in the East Asian winter atmospheric circulation are apparent
Conclusion • Trends are noted in the components studied except the strength of the subtropical jet aloft • indicates an apparent change in the atmospheric circulation pattern • with the exception of the intensifying Aleutian low, all trends found are consistent with a rising winter temperatures in HK and southern China • The covariability between the lower latitudes circulation and the mid-latitude circulation is declining which is another indication of the climatic change in the East Asian winter atmospheric circulation
Discussion • The possibility of anthropogenic forcing of the observed changes cannot be ruled out because natural climate oscillations could have been affected • Difficult to distinguish between natural variability and change due to anthropogenic forcing anthropogenic forcing natural climate oscillations observed changes
1985 EAW EAT NH winter temp HK winter temp CUSUM Changes can be seen in the time series of the winter temperature of NH and winter temperature of Hong Kong in the mid- to late 1980s.
Why SH_I, SH_R and SH_W(they are different features of the SH and do have different influences on the weather) e.g., TC track, rainbelt (south China vs central China) Western-position vs Intensity Intensity vs Ridge-line position Western-position vs Ridge-line position
CUSUM for detrended time series AO PDO SH_W EAW, EAT
Distribution of years year Ranking (from coldest to warmest NH winter temperature after detrending)
Changes in some components of the East Asian winter atmospheric circulation have been suggested to be related to global warming based on the results of coupled GCMs simulations. • These include for examples, the weakening of the Siberia-Mongolia high [BRANDEFLT, 2006], the deepening of Aleutian low [HU et al, 2000] and the weakening of the East Asian winter monsoon [HORI et al, 2006].
The two-sample KS test is one of the most useful and general nonparametric methods for comparing two samples, as it is sensitive to differences in both location and shape of the empirical cumulative distribution functions of the two samples For a single sample of data, the Kolmogorov-Smirnov test is used to test whether or not the sample of data is consistent with a specified distribution function. When there are two samples of data, it is used to test whether or not these two samples may reasonably be assumed to come from the same distribution
Rank correlation (pearson correlation) Hong Kong vs 28 stations in SC 1959-2005 = 0.916 (0.936) 1959-2001 = 0.909 (0.933)
1976 1985 PDO NH winter temp 1988 AO
Western-position Mid-1970sPDO Ridge-line position Intensity CUSUM Charts (2) Sub-tropical high SH
The relationship between the Pacific Decadal Oscillation (PDO) and the Arctic Oscillation (AO) on decadal timescale in the extended winter (November-March) is investigated in this study. The results indicate that AO plays an important role in the low frequency variability of PDO. When AO leads PDO by 7-8 years, the lagging correlation between them becomes the strongest with correlation coefficient 0.77. The leading decadal variability of AO provides a valuably precursory signal for predicting the variability of PDO. The results of regression and lagging correlation reveal the possible mechanism for the AO-PDO coupling: A strong AO would lead to an enhanced Aleutian Low that is linked to PDO by ocean-atmosphere interaction in the North Pacific, and vice versa.
(1) Intensity index (SH_I): The sum of the code of geopotential height 588 dagpm (that is 588 dagpm as 1, 589 as 2, 590 as 3, and so on). Region considered is (110-180oE) (2) Western position index (SH_W): The western most longitude of the contour of 588 dagpm in the region 90-180oE. (3) Ridge-line index (SH_R): The mean latitude of the ridge-line of 588 dagpm contour in the region 110-150oE. It is calculated by averaging the values of latitude of the ridge-line at longitudes 110oE, 115oE, 120oE, 125oE, 130oE, 135oE, 140oE, 145oE and 150oE. The Eurasia westerlies index (Iw) is defined as: where the zonal (Iz) and meridional (Im) indices represent the mid-latitude circulation conditions in the Eurasia sector (0-150oE, 45-65oN) and the  ̄ denotes the average. Detailed definition of Iz and Im can be found in Zhang (1999). Basically, these indices measure zonal and meridional pressure (or geopotential height) gradient aloft, respectively. Positive I corresponds to the dominance of zonal flow pattern in Eurasia.
Northern Annular Mode (Arctic Oscillation) Available format: HTML Table The NAM (or Arctic Oscillation) is defined as the first EOF of NH (20-90N) winter SLP data (see below). It explains 23% of the extended winter mean (December-March) variance, and it is clearly dominated by the NAO structure in the Atlantic sector. Although there are some subtle differences from the regional pattern over the Atlantic and Arctic, the main difference is larger amplitude anomalies over the North Pacific of the same sign as those over the Atlantic. This feature gives the NAM a more annular (or zonally-symmetric) structure. For more information, see http://horizon.atmos.colostate.edu/ao/.
1986/87-2004/05:-0.17/decade (not sig.) 1958/59-1985/86:+0.24/decade (not sig.) Winter temperatures in Hong Kong
>0.8 oC Regime shifts in winter temperature in southern China(average of the 28 stations) 1986/87
Relationship between Arctic Oscillation and winter monsoon Stronger winter monsoon AO (+ve phase) WMI EAWMI late 1980s AO (-ve phase) Weaker winter monsoon
Strength of the Siberia-Mongolia High Longitudinal position of the East Asian Trough
Trend magnitude Result in trend Change point