Download
1 / 8
80 likes | 81 Vues
This article explains the concept of correlation and its application to variables at interval-ratio and ordinal levels. It discusses scattergrams as visual representations and the Pearson correlation coefficient. The statistical significance of correlation is also discussed, emphasizing that correlation does not imply causation. An example is provided to illustrate the use of correlation analysis in testing a research hypothesis.

E N D
CorrelationJuly 7, 2008 Ivan Katchanovski, Ph.D. POL 242Y-Y
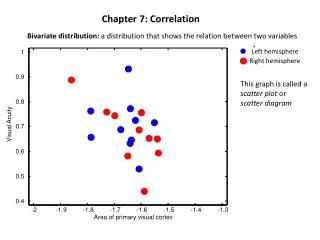
Association between Variables at Interval-ratio and Ordinal Levels • Correlation: Association between variables at interval-ratio level • Can be used for ordinal variables with certain assumptions • Scattergrams: graphical plots of two variables • Provide visual information about the existence, strength and direction of the relationship • Independent variable (X): horizontal axis • Dependent variable (Y): vertical axis
Direction of association Positive Negative No association
Correlation Coefficient (Pearson’s R) • Correlation Coefficient: Pearson’s R • ranges between –1 (negative association) 0 (no association) and 1 (positive association) • 0: no association • 0-0.25: weak association • 0.25-0.5: moderate association • 0.5-0.75: strong association • 0.75-1.0: very strong association
Statistical Significance of Correlation • Statistical Significanceof Correlation Coefficient (R): • Statistically significant if in SPSS p(obtained)<p(critical)=.05 or .01 or .001 • Statistically nonsignificant if SPSS p(obtained)>p(critical)=.05 • Correlation does not always mean causation
Example • Research hypothesis: The level of economic development has a positive effect on civil liberties • Independent variable: the level of economic development • Interval-ratio • Dependent variable: civil liberties • Ordinal
Example • Pearson Correlation Coefficient: .753 • Positive association in expected direction • Very strong association • Statistical significance • SPSS: p(obtained)=.000 <p(critical)=.001=.1% • Statistically significant at the .001 or .1% level • Research hypothesis: supported by correlation analysis • The level of economic development has a positive and statistically significant effect on civil liberties