Download
1 / 28
280 likes | 437 Vues
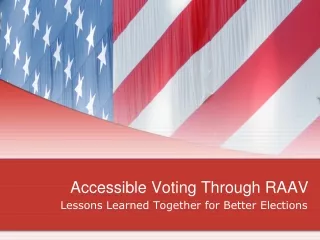
Accessible Voting Through RAAV. Lessons Learned Together for Better Elections. Research Alliance for Accessible Voting. The US Election Assistance Commission ordered a study of Accessbile Voting in response to Congressional mandate.

E N D
Accessible Voting Through RAAV Lessons Learned Together for Better Elections
Research Alliance for Accessible Voting • The US Election Assistance Commission ordered a study of Accessbile Voting in response to Congressional mandate. • Grants provided to two groups, of which RAAV is one, to look at ways to make voting more accessible and to better understand what methodologies will or won’t work to assist elections officials in conducting better elections for voters with accessibility needs. 3 year study.
GOALS of RAAV We will continue to work on technologies and approaches that address a variety of barriers to voting: • Disabilities as defined by the Americans with Disabilities Act (ADA) • Lack of educational opportunity • Difficulties due to aging or other life circumstances • Limited English proficiency
RAAV Partners • Clemson University – Project Manager • Dr. Juan Gilbert and Team • The Center for Accessible Information • Association of Assistive Technology Act Programs (ATAP) • Paraquad • Tennessee Disability Coalition • Election Center (National Association of Election Officials) • Rutgers – School of Management and Labor Relations • Election Data Services • Carnegie Mellon University Silicon Valley
With all that has been done, why this? • Need to view the problem differently • First time to have funds to study what works well and not so well; as well as research to lead to new methods and new technologies • Growing problem in accessibility needs in elections • Ideas for immediate impact on elections • Ideas for future impact on elections
Numbers that affect Accessibility Needs • Depending on what study you look at, the numbers of people in 2012 with accessible needs ranged from a low of 36 million to a high of 54 million • Census Bureau 2010 American Community Survey and 2005 Survey of Income and Program Participation • If this follows the normal American statistical numbers, roughly 75% of are of voting age population (Census estimates 307 million population, 234 million VAP)
Numbers that affect Accessibility Needs • Tidal Wave is Coming • US Census lists Baby Boomers as those between 1946 and 1964: • VAP: 45 and older in 1998 were 80 MM • Same group in 2012 were 120 MM and it continues to grow over next 20 years. • Add to it that life is extended now (average citizen living an additional 15 to 30 years) • Source: US Census Bureau – 2012 Statistical Study Table 399 Voting Age Population
What Does This Mean for Elections? • We will need to rethink the layouts of polling places, rethink how to serve best and likely expect there will be increased costs … but maybe not • Seating in Polling Sites may be needed. Better tools to see ballots; cognitive issues likely to grow; accessible machines may be need by majority of voters; queue management; new wave of voting equipment can be used by all voters • Or there may be changes to how we conduct elections
What Does This Mean for Elections? • It is not just poll workers that are aging. • Add these to the traditional set of voters with access needs • What you will hear today focuses on a large and growing problem but with experts on the various kinds of accessibility issues
RAAV Survey: Rutgers • Lisa Schur – Rutgers School of Management and Labor Relations • Meera Adya – Burlington Blatt Institute at Syracuse University • Doug Kruse - Rutgers School of Management and Labor Relations
Survey Data - Summary • People with disabilities turnout less to vote than people without disabilities • Polling place accessibility is one factor (2009 GAO report says that only 27% of polling places in 2008 had NO impediments to voting). • According to Schur & Ayda, average is 12% lower in 2008 and 2010 • National Survey of 3,022 voters with and without disabilities in 2012
Survey Data - Summary • Voters with disabilities were oversampled to represent 2,000 of the sample and those without disabilities were 1,022 • Oversample was to insure that enough respondents were sampled to reach solid conclusions of their experience in voting in 2012 election.
Survey Data - Summary Table 4: Voted Early or by Mail Among those who reported voting in 2012 Voted early in Voted by mail polling place or election office No disability 30.4% 17.3% Any disability 42.1% 28.1% Disability gap 11.7% ** 10.8% ** By type of disability: Hearing impairment 43.5% ** 28.4% ** Visual impairment 41.0% ** 26.5% ** Cognitive impairment 41.9% ** 30.1% ** Mobility impairment 44.8% ** 31.0% ** Difficulty dressing or bathing 51.0% ** 39.6% ** Difficulty going outside alone 47.8% ** 36.0% ** * Difference from non-disability sample is significant at 95% level ** 99% level
Survey Data - Summary Table 5: Voter Registration Disability No Disability Disability Gap Registered to vote 69.2% 71.5% -2.3% ** Voted if registered 82.1% 87.5% -5.4% ** How registered to vote: Went to a town hall or county/ government registration office 31.5% 22.4% 9.1% ** At a department of motor vehicles 21.9% 30.9% -9.0% ** At a public assistance agency 2.7% 1.3% 1.4% ** Registered by mail 15.8% 16.3% -0.5% Registered at polling place 8.8% 7.7% 1.1% ** Filled out form at a registration drive 7.2% 6.1% 1.1% ** At a school, hospital, or on campus 4.9% 7.1% -2.2% ** Registered using the Internet/online 1.3% 3.9% -2.6% ** Other 6.0% 4.3% 1.7% ** * Difference from non-disability sample is significant at 95% level ** 99% level
Much Good News/Much to Do • What the survey shows is that voters with disabilities are feeling much better about their experience at the polls • At the same time, we continue to experience difficulties in voting so of which can be fixed without great costs but some necessary changes.
Survey Data - Summary Table 8 – Polling Place Difficulties in 2012
Things That Work • All voting equipment should be setup and ready for use for ANY voter – • Waiting for an accessible needs voter means that the unit is not ready and poll workers often indicate they don’t know how to make it function. • Many of the problems with polling place accessibility have to do with signage but also standing, seeing the ballot, marking the ballot – See Table 9 and Table 11.
Attitudes Are Important • Ask all to think if it was them or one of their relatives who had an accessible need how would they want them to be treated? • Which is correct? • Voting is an individual right of eligible US citizens? • Or voting is available only if we can afford it?
Issues That Concern Election Officials • What concerns do you have that you hope we can answer? • What do you wish existed that you have been unable to locate? Email: Doug Lewis dlewis@electioncenter.org Subject: Accessible Voting Election Center, 21946 Royal Montreal Dr STE 100, Houston, TX 77450 Phone:281-396-4309