Download
1 / 28
280 likes | 461 Vues
Simulation of Atlantic warm pool in the Hybrid-Coordinate Ocean Model (HYCOM). SANG-KI LEE 1,2 CHUNZAI WANG 2 , CARLOS LOZANO 3 , and DAN IREDELL 3 1 UMIAMI/CIMAS, 2 NOAA/AOML 3 NOAA/NCEP/EMC. Outline What is Atlantic warm pool (AWP) and why is it important for hurricane?

E N D
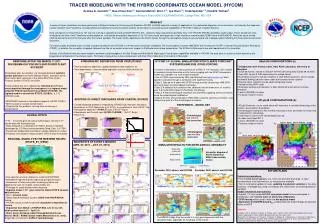
Simulation of Atlantic warm pool in the Hybrid-Coordinate Ocean Model (HYCOM) SANG-KI LEE1,2 CHUNZAI WANG2, CARLOS LOZANO3, and DAN IREDELL3 1UMIAMI/CIMAS, 2NOAA/AOML 3NOAA/NCEP/EMC Outline • What is Atlantic warm pool (AWP) and why is it important for hurricane? • JHT project: diagnose and improve AWP simulation in HYCOM-based RTOFS at NCEP/EMC • How do we measure the performance of HYCOM in simulating AWP? • AWP bias inherent in HYCOM • AWP bias associated with GFS surface flux fields • Accomplishments, conclusions and future works
What is Atlantic Warm Pool (AWP)? NOAA ERSST2: Atlantic warm pool SST in August-September-October • AWP is a body of warm surface water (28.5oC) in the Gulf of Mexico and Caribbean Sea • AWP appears exclusively in boreal summer and fall and disappears in other seasons • Wang and Enfield (2001 GRL)
What is Atlantic Warm Pool (AWP)? NOAA ERSST2: SST composites of large & small AWPs for 1854-2006 • Large AWPs are almost three times larger than small ones • AWP has a large amplitude of variability • Wang, Enfield, Lee and Landsea (2006 JCL)
MH=40 MH=24 Why is AWP Important for Atlantic hurricanes? Major hurricane tracks for large and small AWP years during 1950-2003 • AWP is significantly correlated with tropical storm indices: COR(#TS, AWP) = 0.51 • Large AWPs provide favorable environment for storm formation & intensification by reducing the vertical wind shear and increasing the convective available potential energy in the MDR • AWP also affects North Atlantic Subtropical High, thus it may also influence storm tracks • Thus, It is important to properly simulate AWP in hurricane forecast models
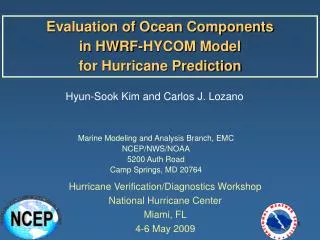
JHT project: diagnose and improve AWP simulation in RTOFS Real-Time Ocean Forecasting System - Atlantic (RTOFS) at NCEP/EMC • RTOFS provides initial and boundary conditions for HWRF-HYCOM, which is an experimental hurricane forecast system at NCEP/EMC • Both RTOFS and HWRF-HYCOM are based on HYCOM • Thus, it is important to evaluate how well HYCOM simulates AWP
How do we measure the performance of HYCOM in simulating AWP? HYCOM uses a conventional bulk formula at the air-sea interface • Is the simulated AWP SST a good measure of HYCOM’s performance? • No: If atmospheric variables are fixed, the model SST is relaxed toward observation • HYCOM error is dumped into QLHF and QSHF. • Thermodynamic inconsistency at the air-sea interface may causes problems if HYCOM is coupled to HWRF q10, 10, u10 and v10 are fixed from observation
How do we measure the performance of HYCOM in simulating AWP? Atmospheric mixed layer (AML) model is coupled to HYCOM • AML model of Seager et al. (1995) is implemented and coupled to HYCOM • AML-HYCOM is an effective way to allow physically consistent air-sea thermal interaction • Minimize thermodynamic inconsistency at the air-sea interface for HWRF-HYCOM • For this study: AML-HYCOM can truly reveal the problems inherent in HYCOM u10 and v10 are fixed from observation
How do we measure the performance of HYCOM in simulating AWP? • Optimal surface flux dataset: 1) Global flux dataset of Large and Yeager (2008) provides a complete set of bias-corrected global surface flux for CORE2 program 2) CORE2 flux dataset is used as the optimal flux dataset to force HYCOM in this study
Three AML-HYCOM experiments (Preliminary) • Three sets of surface flux datasets are used 1. CORE2: 1949-2006 2. NCEP reanalysis-1: 1949-2009 3. GFS (RTOFS is forced with GFS): 2009 • Three sets of multi-year (1949-2009) surface flux datasets are prepared: NCEP reanalysis is used to fill in the missing years for CORE2 and GFS • Three AML-HYCOM experiments are carried out EXP-1) NCEP1_CORE2 EXP-2) NCEP1 (not shown here) EXP-3) Pseudo GFS: (We are currently evaluating)
Three AML-HYCOM experiments (Preliminary) AML-HYCOM is forced with three surface flux datasets for 1949-2009 • 11 deg resolution AML-HYCOM is configured for Atlantic domain (20S-70N) on Mercator coordinate • Configuration details: 1) Levitus data is used for initial and boundary conditions 2) North and South boundaries are relaxed toward Levitus data 3) SSS is relaxed toward Levitus data 4) Land regions must be tiled for AML model
EXP-1: AML-HYCOM_NCEP1_CORE2 EXP-1: AWP SST is colder than observation by more than 2degC • When AML-HYCOM is forced with an optimal surface heat flux dataset, AWP is colder by 2degC • Thus, the cold AWP bias is likely due to model deficiency inherent in HYCOM
EXP-1: AML-HYCOM_NCEP1_CORE2 It is not just HYCOM issue: Cold AWP SST bias is a known problem in fully coupled climate models
EXP-1: AML-HYCOM_NCEP1_CORE2 AWP mixed layer (upper 40m) heat budget for 2009 • Heat budget terms are averaged over the AWP region (100W-40W; 5N-30N) • Vertical mixing and vertical advective heat flux are the only major cooling mechanisms • Thus, we can conclude that vertical mixing and vertical advective heat flux are too large in HYCOM
EXP-3: AML-HYCOM_PSEUDO_GFS EXP-3: AWP SST is slightly warmer than observation • GFS is very different from CORE2 surface flux dataset • This suggest a large bias in GFS surface flux dataset • We are currently evaluating this case
EXP-3: AML-HYCOM_PSEUDO_GFS AWP mixed layer (upper 40m) heat budget for 2009 • Heat budget terms are averaged over the AWP region (100W-40W; 5N-30N) • Vertical mixing is even larger than in EXP-1 • QNET is the only heating term • Thus, QNET is too large
Surface heat flux bias in GFS AWP surface shortwave heat flux for 2009 suggests that GFS is not OK • When compared to CORE2, GFS add up to 50W·m-2 of extra shortwave radiative heat into the AWP region • This means that QSWR is the main cause of the warm bias in EXP-3 • Excessive QSWR overcompensates the excessive cooling in inherent in HYCOM associated with vertical mixing
Accomplishments, conclusions and future works • Accomplishments: 1) HYCOM is coupled to AML to properly diagnose and improve AWP simulation in HYCOM-based RTOFS at NCEP/EMC 2) Three sets of surface flux datasets were prepared and used to carry out preliminary low-resolution AML-HYCOM experiments • Preliminary Conclusions: 1) When forced with an optimized surface flux dataset, AML-HYCOM produces a cold AWP SST bias of ~2degC due to excessive vertical mixing, which is a bias inherent in HYCOM 2) It appears that GFS surface flux datasets put excessive shortwave heat flux into the AWP region of AML-HYCOM (We are currently evaluating this case) • Future works: 1) All three preliminary experiments will be repeated with RTOFS using NCEP/EMC computer resources 2) AML will be fine-tuned 3) Bias correction strategy will be explored
Why is AWP Important for Atlantic hurricanes? NCAR Community Atmospheric Model (CAM3) Experiment • Performed two ensemble experiments using CAM3 • CTRL run: CAM3 is forced using observed SST • NO_AWP run: AWP is removed from SST data (max SST = 26degC) • Wang and Lee (2007 GRL); Wang, Enfield and Lee (2007 JCL)
What is Atlantic Warm Pool (AWP)? NCAR Community Atmospheric Model (CAM3) Experiment • AWP reduces vertical wind shear (200 minus 850mb) • Thus, AWP increases tropical storm formation & intensification • Why?
What is Atlantic Warm Pool (AWP)? NCAR Community Atmospheric Model (CAM3) Experiment • AWP induces an anti-cyclone in the upper troposphere and a cyclone in the lower troposphere • The atmospheric wind anomalies reduce the zonal wind in both the upper and lower troposphere over the MDR • MDR vertical wind shear is reduced as a result • AWP-induced wind changes can be explained by using the simple model of Gill (1980)
What is Atlantic Warm Pool (AWP)? NCAR Community Atmospheric Model (CAM3) Experiment • Convective Available Potential Energy (CAPE) is a measure of the static instability of the troposphere • CAPE is related to the maximum intensity of which a tropical storm can achieve • AWP increases the CAPE in MDR thus more intense storms can form and develop
How do we measure the performance of HYCOM in simulating AWP? • Surface flux datasets: how reliable are they? 1) Taylor (2000): “There is currently no one flux climatology which does not exhibit significant errors in one region or another in each of the various flux components” 2) Enfield and Lee (2005) : “The magnitude of surface net heat flux into the AWP varies by as much as 100 Wm-2 among eight commonly used surface flux climatologies” 3) Lee, Enfield and Wang (2005): HYCOM simulated AWP SST varies by 2degC when HYCOM is forced with the eight surface flux climatologies
EXPERIMENT-2: AML-HYCOM_NCEP1 EXP-2 (AML-HYCOM_NCEP1): AWP SST is colder than observation by 2degC • Advective cooling related to coastal upwelling in the Southern Caribbean Sea is too large • In SON, AWP center is shifted too far east
EXPERIMENT-2: AML-HYCOM_NCEP1 AWP mixed layer (upper 40m) heat budget for 2009 • Heat budget terms are averaged over the AWP region (100W-40W; 5N-30N) • Vertical mixing may be too large • Vertical advective heat flux divergence may be too large • Perhaps, KPP mixing scheme is not effective over AWP region?
Surface heat flux bias in GFS AWP surface net heat flux for 2009 suggests that GFS is biased • When compared to CORE2, GFS add up to 50W·m-2 of extra heat into the AWP region • In all three experiments, the surface net heat flux into AWP is too high • In EXP-1 and -2, it is due to the cold bias and associated reduction in model QLHF • Fixing HYCOM will cure this problem, but not for EXP-3
Surface heat flux bias in GFS AWP surface latent heat flux for 2009 suggests that GFS is OK • QLHF of GFS is very close to CORE2 • In EXP-1 and -2, QLHF is too small • This is caused by the cold bias inherent in HYCOM • QLHF of EXP-3 is too large because the warm bias • This means that QLHF does not cause the warm bias in EXP-3
Surface heat flux bias in GFS AWP surface longwave heat flux for 2009 suggests that GFS is OK • QLWR of GFS is very close to CORE2 • This means that QLWR does not cause the warm bias in EXP-3