Download
1 / 8
110 likes | 277 Vues
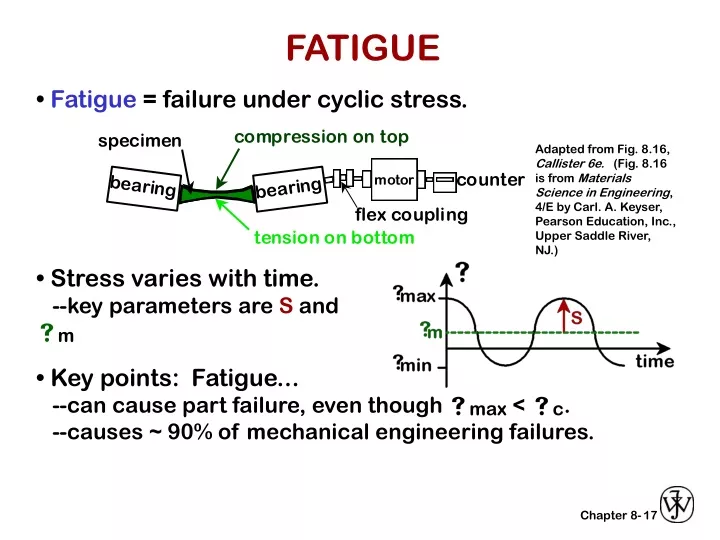
FATIGUE. • Fatigue = failure under cyclic stress. Adapted from Fig. 8.16, Callister 6e. (Fig. 8.16 is from Materials Science in Engineering , 4/E by Carl. A. Keyser, Pearson Education, Inc., Upper Saddle River, NJ.). • Stress varies with time. --key parameters are S and s m.

E N D
FATIGUE • Fatigue = failure under cyclic stress. Adapted from Fig. 8.16, Callister 6e. (Fig. 8.16 is from Materials Science in Engineering, 4/E by Carl. A. Keyser, Pearson Education, Inc., Upper Saddle River, NJ.) • Stress varies with time. --key parameters are S and sm • Key points: Fatigue... --can cause part failure, even though smax < sc. --causes ~ 90% of mechanical engineering failures. 17
FATIGUE DESIGN PARAMETERS • Fatigue limit, Sfat: --no fatigue if S < Sfat Adapted from Fig. 8.17(a), Callister 6e. • Sometimes, the fatigue limit is zero! Adapted from Fig. 8.17(b), Callister 6e. 18
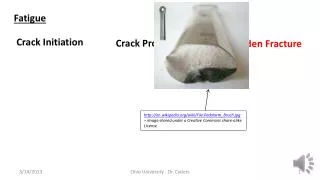
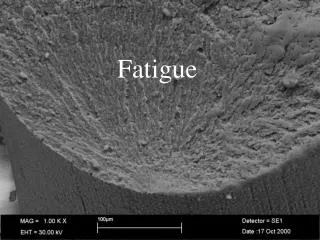
FATIGUE MECHANISM • Crack grows incrementally typ. 1 to 6 increase in crack length per loading cycle crack origin • Failed rotating shaft --crack grew even though Kmax < Kc --crack grows faster if • Ds increases • crack gets longer • loading freq. increases. Adapted from Fig. 8.19, Callister 6e. (Fig. 8.19 is from D.J. Wulpi, Understanding How Components Fail, American Society for Metals, Materials Park, OH, 1985.) 19
IMPROVING FATIGUE LIFE 1. Impose a compressive surface stress (to suppress surface cracks from growing) Adapted from Fig. 8.22, Callister 6e. --Method 1: shot peening --Method 2: carburizing 2. Remove stress concentrators. Adapted from Fig. 8.23, Callister 6e. 20
CREEP • Occurs at elevated temperature, T > 0.4 Tmelt • Deformation changes with time. Adapted from Figs. 8.26 and 8.27, Callister 6e. 21
SECONDARY CREEP • Most of component life spent here. • Strain rate is constant at a given T, s --strain hardening is balanced by recovery stress exponent (material parameter) . activation energy for creep (material parameter) strain rate material const. applied stress Adapted from Fig. 8.29, Callister 6e. (Fig. 8.29 is from Metals Handbook: Properties and Selection: Stainless Steels, Tool Materials, and Special Purpose Metals, Vol. 3, 9th ed., D. Benjamin (Senior Ed.), American Society for Metals, 1980, p. 131.) • Strain rate increases for larger T, s 22
CREEP FAILURE • Failure: along grain boundaries. • Estimate rupture time S 590 Iron, T = 800C, s = 20 ksi g.b. cavities Adapted from Fig. 8.45, Callister 6e. (Fig. 8.45 is from F.R. Larson and J. Miller, Trans. ASME, 74, 765 (1952).) applied stress From V.J. Colangelo and F.A. Heiser, Analysis of Metallurgical Failures (2nd ed.), Fig. 4.32, p. 87, John Wiley and Sons, Inc., 1987. (Orig. source: Pergamon Press, Inc.) 24x103 K-log hr • Time to rupture, tr temperature function of applied stress 1073K Ans: tr = 233hr time to failure (rupture) 23
SUMMARY • Engineering materials don't reach theoretical strength. • Flaws produce stress concentrations that cause premature failure. • Sharp corners produce large stress concentrations and premature failure. • Failure type depends on T and stress: -for noncyclic s and T < 0.4Tm, failure stress decreases with: increased maximum flaw size, decreased T, increased rate of loading. -for cyclic s: cycles to fail decreases as Ds increases. -for higher T (T > 0.4Tm): time to fail decreases as s or T increases. 24