Download
1 / 1
10 likes | 148 Vues
TIME-DISTANCE ANALYSIS OF REALISTIC SIMULATIONS OF SOLAR CONVECTION. Dali Georgobiani, Junwei Zhao 1 , David Benson 2 , Robert Stein 2 , Alexander Kosovichev 1 , Åke Nordlund 3 1 Hansen Experimental Physics Laboratory, Stanford University, Stanford, CA 94305

E N D
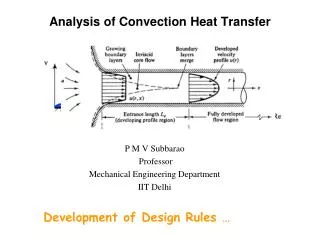
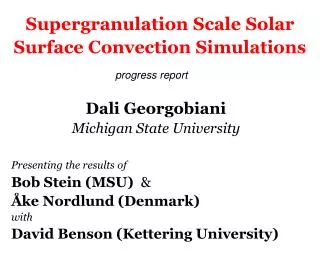
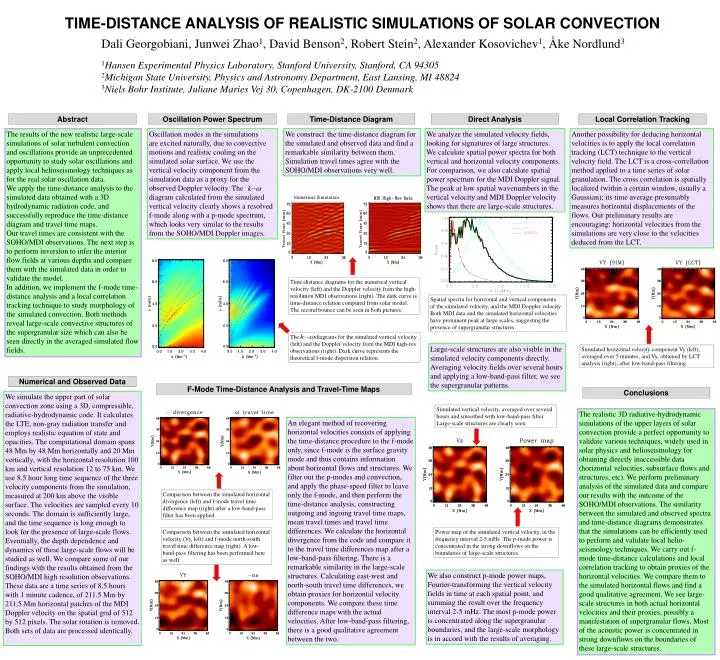
TIME-DISTANCE ANALYSIS OF REALISTIC SIMULATIONS OF SOLAR CONVECTION Dali Georgobiani, Junwei Zhao1, David Benson2, Robert Stein2, Alexander Kosovichev1, Åke Nordlund3 1Hansen Experimental Physics Laboratory, Stanford University, Stanford, CA 94305 2Michigan State University, Physics and Astronomy Department, East Lansing, MI 48824 3Niels Bohr Institute, Juliane Maries Vej 30, Copenhagen, DK-2100 Denmark Abstract Oscillation Power Spectrum Time-Distance Diagram Direct Analysis Local Correlation Tracking The results of the new realistic large-scale simulations of solar turbulent convection and oscillations provide an unprecedented opportunity to study solar oscillations and apply local helioseismology techniques as for the real solar oscillation data. We apply the time-distance analysis to the simulated data obtained with a 3D hydrodynamic radiation code, and successfully reproduce the time-distance diagram and travel time maps. Our travel times are consistent with the SOHO/MDI observations. The next step is to perform inversion to infer the interior flow fields at various depths and compare them with the simulated data in order to validate the model. In addition, we implement the f-mode time- distance analysis and a local correlation tracking technique to study morphology of the simulated convection. Both methods reveal large-scale convective structures of the supergranular size which can also be seen directly in the averaged simulated flow fields. Oscillation modes in the simulations are excited naturally, due to convective motions and realistic cooling on the simulated solar surface. We use the vertical velocity component from the simulation data as a proxy for the observed Doppler velocity. The diagram calculated from the simulated vertical velocity clearly shows a resolved f-mode along with a p-mode spectrum, which looks very similar to the results from the SOHO/MDI Doppler images. We constructthe time-distance diagram for the simulated and observed data and find a remarkable similarity between them. Simulation travel times agree with the SOHO/MDI observations very well. We analyze the simulated velocity fields, looking for signatures of large structures. We calculate spatial power spectra for both vertical and horizontal velocity components. For comparison, we also calculate spatial power spectrum for the MDI Doppler signal. The peak at low spatial wavenumbers in the vertical velocity and MDI Doppler velocity shows that there are large-scale structures. Another possibility for deducing horizontal velocities is to apply the local correlation tracking (LCT) technique to the vertical velocity field. The LCT is a cross-correllation method applied to a time series of solar granulation. The cross correlation is spatially localized (within a certain window, usually a Gaussian); its time average presumably measures horizontal displacements of the flows. Our preliminary results are encouraging: horizontal velocities from the simulations are very close to the velocities deduced from the LCT. Time-distance diagrams for the numerical vertical velocity (left) and the Doppler velocity from the high-resolution MDI observations (right). The dark curve is time-distance relation computed from solar model. The second bounce can be seen in both pictures. Spatial spectra for horizontal and vertical components of the simulated velocity, and the MDI Doppler velocity. Both MDI data and the simulated horizontal velocities have prominent peak at large scales, suggesting the presence of supergranular structures. The diagrams for the simulated vertical velocity (left) and the Doppler velocity from the MDI high-res observations (right). Dark curve represents the theoretical f-mode dispersion relation. Large-scale structures are also visible in the simulated velocity components directly. Averaging velocity fields over several hours and applying a low-band-pass filter, we see the supergranular patterns. Simulated horizontal velocity component Vy (left), averaged over 5 minutes, and Vy, obtained by LCT analysis (right), after low-band-pass filtering. Numerical and Observed Data F-Mode Time-Distance Analysis and Travel-Time Maps Conclusions We simulate the upper part of solar convection zone using a 3D, compressible, radiative-hydrodynamic code. It calculates the LTE, non-gray radiation transfer and employs realistic equation of state and opacities. The computational domain spans 48 Mm by 48 Mm horizontally and 20 Mm vertically, with the horizontal resolution 100 km and vertical resolution 12 to 75 km. We use 8.5 hour long time sequence of the three velocity components from the simulation, measured at 200 km above the visible surface. The velocities are sampled every 10 seconds. The domain is sufficiently large, and the time sequence is long enough to look for the presence of large-scale flows. Eventually, the depth dependence and dynamics of these large-scale flows will be studied as well. We compare some of our findings with the results obtained from the SOHO/MDI high resolution observations. These data are a time series of 8.5 hours with 1 minute cadence, of 211.5 Mm by 211.5 Mm horizontal patches of the MDI Doppler velocity on the spatial grid of 512 by 512 pixels. The solar rotation is removed. Both sets of data are processed identically. Simulated vertical velocity, averaged over several hours and smoothed with low-band-pass filter. Large-scale structures are clearly seen. The realistic 3D radiative-hydrodynamic simulations of the upper layers of solar convection provide a perfect opportunity to validate various techniques, widely used in solar physics and helioseismology for obtaining directly inaccessible data (horizontal velocities, subsurface flows and structures, etc). We perform preliminary analysis of the simulated data and compare our results with the outcome of the SOHO/MDI observations. The similarity between the simulated and observed spectra and time-distance diagrams demonstrates that the simulations can be efficiently used to perform and validate local helio- seismology techniques. We carry out f- mode time-distance calculations and local correlation tracking to obtain proxies of the horizontal velocities. We compare them to the simulated horizontal flows and find a good qualitative agreement. We see large-scale structures in both actual horizontal velocities and their proxies, possibly a manifestation of supergranular flows. Most of the acoustic power is concentrated in strong downflows on the boundaries of these large-scale structures. An elegant method of recovering horizontal velocities consists of applying the time-distance procedure to the f-mode only, since f-mode is the surface gravity mode and thus contains information about horizontal flows and structures. We filter out the p-modes and convection, and apply the phase-speed filter to leave only the f-mode, and then perform the time-distance analysis, constructing outgoing and ingoing travel time maps, mean travel times and travel time differences. We calculate the horizontal divergence from the code and compare it to the travel time differences map after a low-band-pass filtering. There is a remarkable similarity in the large-scale structures. Calculating east-west and north-south travel time differences, we obtain proxies for horizontal velocity components. We compare these time difference maps with the actual velocities. After low-band-pass filtering, there is a good qualitative agreement between the two. Comparison between the simulated horizontal divergence (left) and f-mode travel time difference map (right) after a low-band-pass filter has been applied. Comparison between the simulated horizontal velocity (Vy, left) and f-mode north-south travel time difference map (right). A low-band-pass filtering has been performed here as well. Power map of the simulated vertical velocity, in the frequency interval 2-5 mHz. The p-mode power is concentrated in the strong downflows on the boundaries of large-scale structures. We also construct p-mode power maps, Fourier-transforming the vertical velocity fields in time at each spatial point, and summing the result over the frequency interval 2-5 mHz. The most p-mode power is concentrated along the supergranular boundaries, and the large-scale morphology is in accord with the results of averaging.