Download
1 / 49
520 likes | 856 Vues
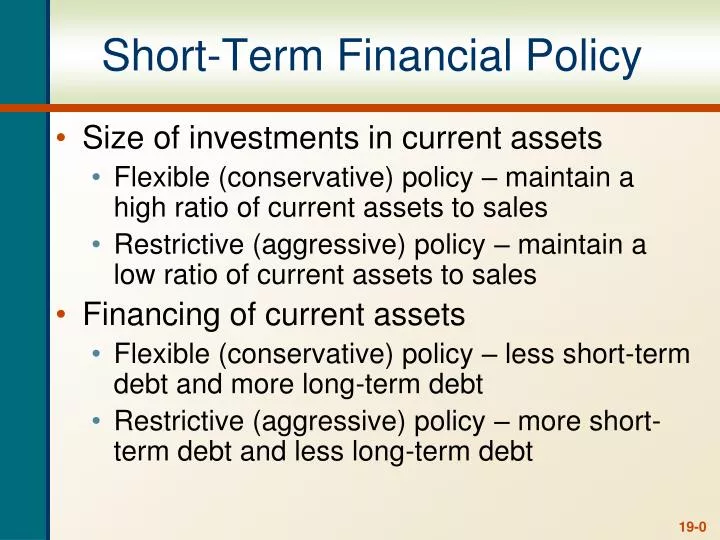
Short-Term Financial Policy. Size of investments in current assets Flexible (conservative) policy – maintain a high ratio of current assets to sales Restrictive (aggressive) policy – maintain a low ratio of current assets to sales Financing of current assets

E N D
Short-Term Financial Policy • Size of investments in current assets • Flexible (conservative) policy – maintain a high ratio of current assets to sales • Restrictive (aggressive) policy – maintain a low ratio of current assets to sales • Financing of current assets • Flexible (conservative) policy – less short-term debt and more long-term debt • Restrictive (aggressive) policy – more short-term debt and less long-term debt
Carrying vs. Shortage Costs • Managing short-term assets involves a trade-off between carrying costs and shortage costs • Carrying costs – increase with increased levels of current assets, the costs to store and finance the assets • Shortage costs – decrease with increased levels of current assets • Trading or order costs • Costs related to safety reserves, i.e., lost sales and customers and production stoppages
Temporary vs. Permanent Assets • Temporary current assets • Sales or required inventory build-up may be seasonal • Additional current assets are needed during the “peak” time • The level of current assets will decrease as sales occur • Permanent current assets • Firms generally need to carry a minimum level of current assets at all times • These assets are considered “permanent” because the level is constant, not because the assets aren’t sold
Choosing the Best Policy • Cash reserves • High cash reserves mean that firms will be less likely to experience financial distress and are better able to handle emergencies or take advantage of unexpected opportunities • Cash and marketable securities earn a lower return and are zero NPV investments • Maturity hedging • Try to match financing maturities with asset maturities • Finance temporary current assets with short-term debt • Finance permanent current assets and fixed assets with long-term debt and equity • Interest Rates • Short-term rates are normally lower than long-term rates, so it may be cheaper to finance with short-term debt • Firms can get into trouble if rates increase quickly or if it begins to have difficulty making payments – may not be able to refinance the short-term loans • Have to consider all these factors and determine a compromise policy that fits the needs of the firm
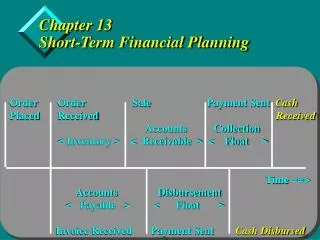
Cash Budget • Forecast of cash inflows and outflows over the next short-term planning period • Primary tool in short-term financial planning • Helps determine when the firm should experience cash surpluses and when it will need to borrow to cover working-capital costs • Allows a company to plan ahead and begin the search for financing before the money is actually needed
Example: Cash Budget Information • Pet Treats Inc. specializes in gourmet pet treats and receives all income from sales • Sales estimates (in millions) • Q1 = 500; Q2 = 600; Q3 = 650; Q4 = 800; Q1 next year = 550 • Accounts receivable • Beginning receivables = $250 • Average collection period = 30 days • Accounts payable • Purchases = 50% of next quarter’s sales • Beginning payables = 125 • Accounts payable period is 45 days • Other expenses • Wages, taxes and other expense are 30% of sales • Interest and dividend payments are $50 • A major capital expenditure of $200 is expected in the second quarter • The initial cash balance is $80 and the company maintains a minimum balance of $50
Example: Cash Budget – Cash Collections • ACP = 30 days, this implies that 2/3 of sales are collected in the quarter made and the remaining 1/3 are collected the following quarter • Beginning receivables of $250 will be collected in the first quarter
Example: Cash Budget – Cash Disbursements • Payables period is 45 days, so half of the purchases will be paid for each quarter and the remaining will be paid the following quarter • Beginning payables = $125
Short-Term Borrowing • Unsecured Loans • Line of credit • Committed vs. noncommitted (usually for one year) • Formal vs “credit card” • Revolving credit arrangement (multi-year) • Letter of credit – bank guarantees payment • Compensating balance • Secured Loans • Accounts receivable financing • Assigning – company responsible for bad debt • Factoring – factor responsible for bad debt • Inventory loans • Blanket inventory lien – all inventory • Trust receipt – specific inventory • Field warehouse financing – independent co. controls inv. for lender • Commercial Paper • Trade Credit
Example: Compensating Balance • We have a $500,000 line of credit with a 15% compensating balance requirement. The quoted interest rate is 9%. We need to borrow $150,000 for inventory for one year. • How much do we need to borrow? • 150,000/(1-.15) = 176,471 • What interest rate are we effectively paying? • Interest paid = 176,471(.09) = 15,882 • Effective rate = 15,882/150,000 = .1059 or 10.59%
Example: Factoring • Last year your company had average accounts receivable of $2 million. Credit sales were $24 million. You factor receivables by discounting them 2%. What is the effective rate of interest? • Receivables turnover = 24/2 = 12 times • APR = 12(.02/.98) = .2449 or 24.49% • EAR = (1+.02/.98)12 – 1 = .2743 or 27.43%
Target Cash Balances • Target cash balance – desired cash level determined by trade-off between carrying costs and shortage costs • Flexible policy - if a firm maintains a marketable securities account, the primary shortage cost is the trading cost from buying and selling securities • Restrictive policy – generally borrow short-term, so the shortage costs will be the fees and interest associated with arranging a loan
BAT Model • Assumptions • Cash is spent at the same rate every day • Cash expenditures are known with certainty • Optimal cash balance is where opportunity cost of holding cash = trading cost • Opportunity cost = (C/2)*R • Trading cost = (T/C)*F • Total cost = (C/2)*R + (T/C)*F
Example: BAT Model • Your firm will have $5 million in cash expenditures over the next year. The interest rate is 4% and the fixed trading cost is $25 per transaction. • What is the optimal cash balance? • What is the average cash balance? • What is the opportunity cost? • What is the trading cost? • What is the total cost?
Avg. Balance = $5M/365 = $13,698.63 • Opp. Cost = $79,057(.04/2) = $1,581.14 • Trading cost = ($5M)($25)/$79,057 • = $1,581.14 • Total cost = $1,581.14(2) = $3,162.28
Miller-Orr Model • Model for cash inflows and outflows that fluctuate randomly • Define an upper limit, a lower limit and a target balance • Management sets lower limit, L • C* = L + [(3/4)F2/R]1/3 (target balance) • U* = 3C* - 2L (upper limit) • Average cash balance = (4C* - L)/3
Example: Miller-Orr Model • Suppose that we wish to maintain a minimum cash balance of $5,000. Our fixed trading cost is $250 per trade, the interest rate is .5% per month and the standard deviation of monthly cash flows is $1,000. • What is the target cash balance? • What is the upper limit? • What is the average cash balance?
C* = L + [(3/4)F2/R]1/3 • C* = $5,000 + [(3/4)($250)($1,0002)/.005]1/3 • C* = $5,572.36 • U* = 3C* - 2L • U* = 3($5,572) – 2($5,000) • U* = $6,717.07
Average cash balance = (4C* - L)/3 • = ((4)($5,572) – 5,000)/3 • = $5,763.10
Conclusions • The greater the interest rate, the lower the target cash balance • The greater the fixed order cost, the higher the target cash balance • It is generally more expensive to borrow needed funds than it is to sell marketable securities • Trading costs are usually very small relative to opportunity costs for large firms
Terms of Sale • Basic Form: 2/10 net 45 • 2% discount if paid in 10 days • Total amount due in 45 days if discount not taken • Buy $500 worth of merchandise with the credit terms given above • Pay $500(1 - .02) = $490 if you pay in 10 days • Pay $500 if you pay in 45 days
Example: Cash Discounts • Finding the implied interest rate when customers do not take the discount • Credit terms of 2/10 net 45 • Period rate = 2 / 98 = 2.0408% • Period = (45 – 10) = 35 days • 365 / 35 = 10.4286 periods per year • EAR = (1.020408)10.4286 – 1 = 23.45% • The company benefits when customers choose to forgo discounts
Credit Policy Effects • Revenue Effects • Delay in receiving cash from sales • May be able to increase price • May increase total sales • Cost Effects • Cost of the sale is still incurred even though the cash from the sale has not been received • Cost of debt – must finance receivables • Probability of nonpayment – some percentage of customers will not pay for products purchased • Cash discount – some customers will pay early and pay less than the full sales price
Example: Evaluating a Proposed Policy – Part I • Your company is evaluating a switch from a cash only policy to a net 30 policy. The price per unit is $100 and the variable cost per unit is $40. The company currently sells 1000 units per month. Under the proposed policy, the company will sell 1050 units per month. The required monthly return is 1.5%. • What is the NPV of the switch? • Should the company offer credit terms of net 30?
Example: Evaluating a Proposed Policy – Part II • Incremental cash inflow • (100 – 40)(1050 – 1000) = 3000 • Present value of incremental cash inflow • 3000/.015 = 200,000 • Cost of switching • 100(1000) + 40(1050 – 1000) = 102,000 • NPV of switching • 200,000 – 102,000 = 98,000 • Yes the company should switch
Total Cost of Granting Credit • Carrying costs • Required return on receivables • Losses from bad debts • Costs of managing credit and collections • Shortage costs • Lost sales due to a restrictive credit policy • Total cost curve • Sum of carrying costs and shortage costs • Optimal credit policy is where the total cost curve is minimized
Credit Analysis • Process of deciding which customers receive credit • Gathering information • Financial statements • Credit reports • Banks • Payment history with the firm • Determining Creditworthiness • 5 C’s of Credit • Credit Scoring
Five Cs of Credit • Character – willingness to meet financial obligations • Capacity – ability to meet financial obligations out of operating cash flows • Capital – financial reserves • Collateral – assets pledged as security • Conditions – general economic conditions related to customer’s business
Example: One-Time Sale • NPV = -v + (1 - )P / (1 + R) • Your company is considering granting credit to a new customer. The variable cost per unit is $50, the current price is $110, the probability of default is 15% and the monthly required return is 1%. • NPV = -50 + (1-.15)(110)/(1.01) = 42.57 • What is the break-even probability? • 0 = -50 + (1 - )(110)/(1.01) • = .5409 or 54.09%
Example: Repeat Customers • NPV = -v + (1-)(P – v)/R • Look at the previous example, what is the NPV if we are looking at repeat business? • NPV = -50 + (1-.15)(110 – 50)/.01 = 5,050 • Repeat customers can be very valuable (hence the importance of good customer service) • It may make sense to grant credit to almost everyone once, as long as the variable cost is low relative to the price • If a customer defaults once, you don’t grant credit again
Inventory Management • Inventory can be a large percentage of a firm’s assets • There can be significant costs associated with carrying too much inventory • There can also be significant costs associated with not carrying enough inventory • Inventory management tries to find the optimal trade-off between carrying too much inventory versus not enough
Types of Inventory • Manufacturing firm • Raw material – starting point in production process • Work-in-progress • Finished goods – products ready to ship or sell • Remember that one firm’s “raw material” may be another firm’s “finished good” • Different types of inventory can vary dramatically in terms of liquidity
Inventory Costs • Carrying costs – range from 20 – 40% of inventory value per year • Storage and tracking • Insurance and taxes • Losses due to obsolescence, deterioration or theft • Opportunity cost of capital • Shortage costs • Restocking costs • Lost sales or lost customers • Consider both types of costs and minimize the total cost
Inventory Management - ABC • Classify inventory by cost, demand and need • Those items that have substantial shortage costs should be maintained in larger quantities than those with lower shortage costs • Generally maintain smaller quantities of expensive items • Maintain a substantial supply of less expensive basic materials
EOQ Model • T = number ordered • F = Fixed costs per order • CC = carrying costs/units
EOQ Model • The EOQ model minimizes the total inventory cost • Total carrying cost = (average inventory) x (carrying cost per unit) = (Q/2)(CC) • Total restocking cost = (fixed cost per order) x (number of orders) = F(T/Q) • Total Cost = Total carrying cost + total restocking cost = (Q/2)(CC) + F(T/Q)
Example: EOQ • Consider an inventory item that has carrying cost = $1.50 per unit. The fixed order cost is $50 per order and the firm sells 100,000 units per year. • What is the economic order quantity?