Download
1 / 32
320 likes | 486 Vues
In solid organ and hematopoietic stem cell transplantation As triggers for pre-emptive therapy for disease prevention For disease diagnosis For treatment monitoring As surrogate markers of anti-viral resistance For safety monitoring in clinical trials (new immunosuppressive agents) Other

E N D
In solid organ and hematopoietic stem cell transplantation As triggers for pre-emptive therapy for disease prevention For disease diagnosis For treatment monitoring As surrogate markers of anti-viral resistance For safety monitoring in clinical trials (new immunosuppressive agents) Other Disease diagnosis and treatment monitoring other EBV-related disease- nasopharyngeal carcinoma ,NK and Hodgkin’s lymphoma Population based screening- congenital CMV disease Potential uses of EBV and CMV viral load assays
Many “In-house” ; not standardized or cross referenced Optimal sampling site uncertain - serum, Leukocytes/lymphocytes, whole blood Optimal sampling frequency uncertain Natural history studies are scarce so that “trigger points” for intervention have not been clearly defined CMV and EBV Viral Load AssaysCurrent Problems
Development of an International Standard for EBV and CMV Viral Load Assessment Dr Jutta K Preiksaitis Provincial Public Health Laboratory (Alberta) University of Alberta Edmonton and Calgary, Alberta Canada On behalf of the American Society of Transplantation Infectious Diseases Community of Practice and the Canadian Society of Transplantation
To examine the inter-laboratory variability in qualitative and quantitative CMV and EBV viral load assessments Funded by the American Society of Transplantation and the Canadian Society of Transplantation ( arms-length educational grant Roche Canada) Coordinated through the American Society of Transplantation Infectious Diseases Community of Practice Objective of Study
Viral stock (purified nucleocapsids of Merlin, a clinical isolate in human in CMV seronegative human plasma) Quantified by nucleocapsid count using electron microscopy log 10 copies/ml =4.52 Calculation of a mean of replicate viral load results from seven reference laboratories (included use of all available commercial assays) log 10 copies/ml =5.0 Establishing the “expected result”
12 samples 2 negatives (CMV seronegative plasma) 7 samples -dilutions of purified viral stock; replicates of two dilutions were included 3 clinical samples (1:30 dilution in CMV seronegative plasma) UL54 mutation (not ganciclovir resistant) UL97mutation (ganciclovir resistant) and gB mutation No mutation Panel Design
CMV PCR Methods Utilized n=35 panels (33 labs)19 US, 12 Canada , 2 EU
7.00 6.50 6.00 5.50 5.00 4.50 4.00 3.50 3.00 2.50 2.00 1.50 1.00 0.50 0.00 05 03 10 11 09 04 12 06 01 08 07 02 Clinical sample CMV viral panel sample Expected result based on stock quantified by reference laboratories Positive but not quantifiable (assigned lowest detectable value) Results Summary 35 panels / 33 laboratories CMV DNA Copies/ml (log10) CMV DNA Copies/ml (log10) CMV Sample Number
Summary of CMV Qualitative Results (constructed samples) 35 panels / 33 labs † One test was invalid Pos-NQ: positive but not quantifiable Pos-Q: positive with quantifiable results
Summary of CMV Quantitative results (constructed samples) 35 panels / 33 laboratories † Geometric mean; negative results were excluded
CMV quantitative results relative to expected result [reference labs as “gold” standard] §negative results were excluded
CMV Qualitative and Quantitative results (clinical samples) 35 panels / 33 laboratories † GM=Geometric mean; negative results were excluded
Result linearity over dynamic range (each line represents results from one lab) Commercial assays (Lab =17) In - house assays (Lab =18) 7.00 7.00 6.00 6.00 5.00 5.00 4.00 4.00 CMV copies/ml (log10) using PCR 3.00 3.00 2.00 2.00 1.00 1.00 0.00 0.00 0 1 2 3 4 5 6 7 0 1 2 3 4 5 6 7 CMV Copies/ml (log10) Expected result
Comparison of Intra and Inter laboratory variation in CMV vial load assessments in duplicate specimens * Fisher Exact Test (two tailed)
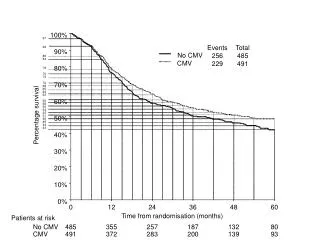
Significant variation exists in reported results. The greatest variation was observed in clinical samples and constructed samples with low viral load. As viral load increased, there was less variation independent of the assay platforms used (commercial versus in-house) False negative results were not observed in samples with viral load greater than 3.0 log copies/ml (expected result) even when lower limit of detection reported was higher than this value Variation is lower limits of detection may have significant impact on duration of treatment based on recommendation of treatment until viral load is non-detectable If ± 0.5 log10 is considered “acceptable” assay variation, only 62.5 % of the results observed fell within this range CMV Conclusions
CMV Conclusions • As a group, commercial assays demonstrated overall less variability compared to all “in house” developed assays, but some of the former have limitations related to lower sensitivity and limited dynamic range • Inter-laboratory variability was significantly greater than intra-laboratory variability, highlighting the need for an international referencestandard for assay calibration
EBV viral stock (Namalwa cell line in EBV seronegative plasma) Quantified by Namalwa cell count using assumption of 2 EBV genome copies per cell Calculation of a geometric mean of replicate viral load results from seven reference laboratories ( included use of all available commercial assays) Establishing the “expected result”
12 samples Constructed samples-(total cell count in each sample fixed to mimic total white cell count in normal peripheral blood) 2 negatives ( EBV-negative Molt-3 cells in EBV seronegative plasma) 7 samples -dilutions of EBV-positive Namalwa cells and EBV-negative Molt-3 cells ; two dilutions were replicated 3 clinical plasma samples (diluted in EBV seronegative plasma) Two patients had EBV-positive B cell post-transplant lymphoproliferative disorder Panel Design
EBV PCR Methods Utilized n=30 panels (28 labs)16 US, 11 Canada, 2 EU
Results Summary 30 panels / 28 laboratories 7.00 7.00 6.00 6.00 5.00 5.00 4.00 4.00 EBV DNA copies/ml (log10) 3.00 3.00 2.00 2.00 1.00 1.00 0.00 0.00 01 01 01 08 08 08 09 09 09 03 03 03 05 05 05 10 10 10 02 02 02 11 11 11 06 06 06 07 07 07 04 04 04 12 12 12 Clinical Samples Clinical Samples EBV Viral Panel Samples EBV Viral Panel Samples EBV Sample Number Gold Standard Expected Result Based on Cell Count Positive but not quantifiable (assigned lowest detectable value)
Summary of EBV Qualitative Results (constructed samples) 30 panels reported from 28 laboratories Quantitation based on cell count Pos-NQ: positive, not quantifiable Pos-Q: positive, quantifiable
Summary of EBV Quantitative results (Constructed Samples) 30 panels reported from 28 labs †Geometric mean; negative results were excluded
EBV quantitative results (constructed samples) relative to expected result [Namalwa cell count as “gold” standard] §negative results were excluded
EBV Qualitative and Quantitative results (clinical samples) 30 panels reported from 28 labs † GM= Geometric mean
Commercial assays (Lab =12) In-house assays (Lab = 18) EBV copies/ml (log10) using PCR EBV copies/ml expected quantification based on cell count Result linearity over dynamic range (each line represents results from one lab)
Comparison of Intra and Inter laboratory variation in EBV vial load assessments in duplicate specimens * Fisher Exact Test (two tailed)
Significant variation in reported results exists in all samples independent of viral load and of assay platforms used (commercial versus in-house) If ± 0.5 log10 is considered “acceptable” variation in a Q NAT assay, our results indicate that only 56 % of all results fell within that parameter Greater QNAT variations were observed in cellular constructed samples when compared to acellular plasma samples indicating that DNA extraction in cellular samples may need further improvement Inter-laboratory variability was significantly greater than intra-laboratory variability, highlighting the need for an international reference standard for assay calibration Conclusions
Highest Priority Establishment of an international reference standard for EBV and CMV qualitative and quantitative assay calibration Next Steps
Technical Committee Dr Xiao-Li Pang Dr Julie Fox Dr Geraldine Miller Dr Angie Caliendo Technical and other support Jayne Fenton Sandra Shokopoles Kim Martin Ana Shynader AST ID Community of Practice Dr John Saldanha Dr Alan Heath Acknowledgments
Participating Laboratories USA • UCLA Healthcare Clinical Labs, Los Angeles • Stanford Hospital and Clinics, Stanford • Yale-New Haven Hospital, New Haven • Emory Hospital, Atlanta • University of Iowa, Iowa City • University of Chicago Hospitals, Chicago • Johns Hopkins Hospital, Baltimore • University of Michigan Medical Center, Ann Arbor • Warde Medical Laboratory, Ann Arbor • Mayo Clinic, Rochester • St. Louis Children’s Hospital, St. Louis • Viracor Laboratories, Lee’s Summit • University of North Carolina Hospital, Chapel Hill • Mt. Sinai Hospital, New York • Cleveland Clinic, Cleveland • Oregon Health & Science University, Portland • Children’s Hospital of Pittsburgh, Pittsburgh • Vanderbilt University Medical Center, Nashville • Seattle Cancer Care Alliance, University of Washington, Seattle • Children’s Hospital, Birmingham Canada • Children’s Hospital of British Columbia, Vancouver • St. Paul’s Hospital, Vancouver • Provincial Laboratory for Public Health Alberta, Edmonton & Calgary • National Microbiology Laboratory, Winnipeg • St. Joseph’s Health Care, Hamilton • Hospital for Sick Children, Toronto • Mt. Sinai Hospital, Toronto • Children’s Hospital of Eastern Ontario, Ottawa • London Laboratory Services, London • St. Justine Hospital, Montreal • Centre hospitalier de l'Université Laval, Quebec City • QE II Health Sciences Centre, Halifax • Newfoundland Public Health Laboratory, St. John’s Europe • Erasmus MC, University Medical Center Rotterdam, The Netherlands • Institute for Medical Microbiology, Basel, Switzerland