Download
1 / 17
170 likes | 305 Vues
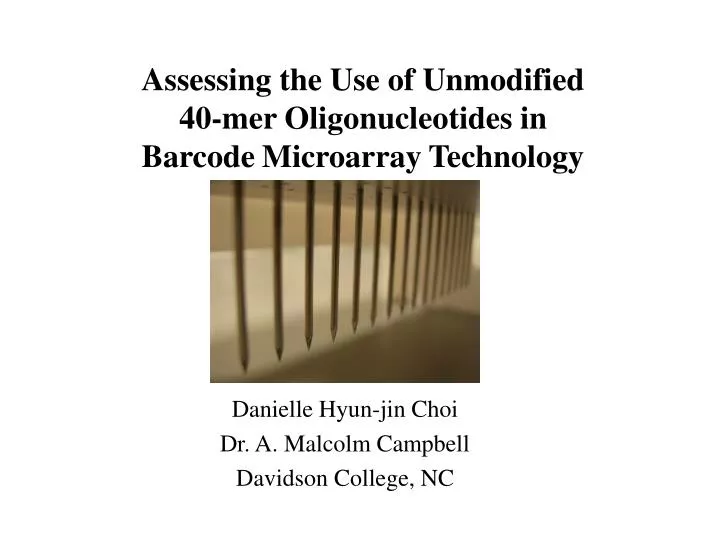
Assessing the Use of Unmodified 40-mer Oligonucleotides in Barcode Microarray Technology. Danielle Hyun-jin Choi Dr. A. Malcolm Campbell Davidson College, NC. Introduction to Genomics and Microarrays. What is a microarray? What is Genomics?. How do you print a microarray?.

E N D
Assessing the Use of Unmodified 40-mer Oligonucleotides in BarcodeMicroarrayTechnology Danielle Hyun-jin Choi Dr. A. Malcolm Campbell Davidson College, NC
Introduction to Genomics and Microarrays • What is a microarray? • What is Genomics?
How do you print a microarray? Printed microarrays Stored microarrays
Cy3 Laser Channel Cy5 Laser Channel Generating Microarray Data + =
Barcode Microarray Method • The red and green arrows represent PCR primers • Unique combination of A, C, G, Ts for each barcode yeast strain • Barcode microarray uses these unique sequences as printing material • Each spot on microarray represents a unique barcode sequence of a deletion strain
Synthesizing Probes for Barcode Microarray • Allow the mixture of different barcode yeast strains to grow • Take a sample of the initial population, use the gDNA as templates for PCR using the two pairs of primers, then label the products with red dye • After the different deletion strains grow more, competing with each other, take another sample and label the products with green dye
My Research Questions • Can we make barcode microarrays on glass? • Is there steric hindrance? • What is the optimal probe concentration? • What is the optimal hybridization temperature?
Probe to Buffer Ratio Was signal strong enough to be analyzed? 1:500 No 1:50 No 1:25 No 1:5 Yes 1:3.3 Yes 1:2.5 Yes Concentration Dependence • Suggested concentration of 1:500 in the protocol resulted in no visible spots after scanning • No significant difference in signal strength was observed between the last three concentrations
Hybridization and Data Analysis • 96 samples of 40-mer barcodes from Johns Hopkins University • Two identical probes only differing in label colors, prepared by Drs. Daniel S. Yuan and Jef Boeke
Notable Trends in Data • Because the probes were prepared identically, only differing in the color label, the ratios were expected to be close to 1 • Ratios consistently hovered around 0.5 (Cy5/Cy3) due to weaker Cy5 (Red) signal compared to Cy3 (Green) signal
Methods Mean1:5 Mean1:3.3 Mean1:2.5 F variate F critical P value Reject null hypothesis? MAGIC (total) 0.624 0.627 0.659 1.657 3.013 0.192 No MAGIC (total-bg) 0.526 0.593 0.565 2.865 3.02 0.058 No Scanalyze (total) 1.332 0.924 1.033 74.87 3.013 2.27E-29 Yes MAGIC (avg-bg) 0.546 0.566 0.574 3.917 3.013 0.020 Yes Scanalyze (avg-bg) 0.463 0.526 0.540 33.75 3.012 1.593E-14 Yes Software Dependence • Depending on the image and data analysis program (MAGIC Tool and Scanalyze), statistical significance of the ratios varied
Discussion and Future Directions • Signal seems strong enough to generate quality ratio data • Higher incubation temperatures (40°C and 43°C) at two different probe to buffer ratios have been tested and being analyzed • Synthesize probes with dendrimer binding sequences and use dendrimers as fluorescent dyes to increase signal
Acknowledgements • Duke Endowment • National Science Foundation • Davidson College • Dr. Daniel S. Yuan, Dr. Jef Boeke, Johns Hopkins University