Download
1 / 1

E N D
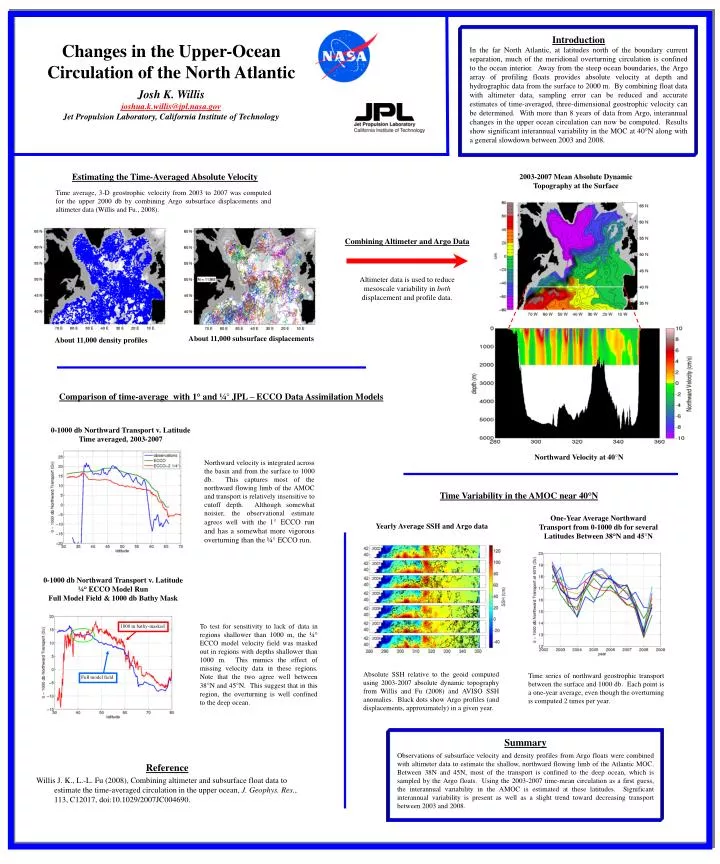
1000 m bathy-masked Full model field Introduction In the far North Atlantic, at latitudes north of the boundary current separation, much of the meridional overturning circulation is confined to the ocean interior. Away from the steep ocean boundaries, the Argo array of profiling floats provides absolute velocity at depth and hydrographic data from the surface to 2000 m. By combining float data with altimeter data, sampling error can be reduced and accurate estimates of time-averaged, three-dimensional geostrophic velocity can be determined. With more than 8 years of data from Argo, interannual changes in the upper ocean circulation can now be computed. Results show significant interannual variability in the MOC at 40°N along with a general slowdown between 2003 and 2008. Changes in the Upper-Ocean Circulation of the North Atlantic Josh K. Willis joshua.k.willis@jpl.nasa.gov Jet Propulsion Laboratory, California Institute of Technology Estimating the Time-Averaged Absolute Velocity 2003-2007 Mean Absolute Dynamic Topography at the Surface Time average, 3-D geostrophic velocity from 2003 to 2007 was computed for the upper 2000 db by combining Argo subsurface displacements and altimeter data (Willis and Fu., 2008). Combining Altimeter and Argo Data Altimeter data is used to reduce mesoscale variability in both displacement and profile data. About 11,000 subsurface displacements About 11,000 density profiles Comparison of time-average with 1° and ¼°JPL – ECCO Data Assimilation Models 0-1000 db Northward Transport v. Latitude Time averaged, 2003-2007 Northward Velocity at 40°N Northward velocity is integrated across the basin and from the surface to 1000 db. This captures most of the northward flowing limb of the AMOC and transport is relatively insensitive to cutoff depth. Although somewhat noisier, the observational estimate agrees well with the 1° ECCO run and has a somewhat more vigorous overturning than the ¼° ECCO run. Time Variability in the AMOC near 40°N One-Year Average Northward Transport from 0-1000 db for several Latitudes Between 38°N and 45°N Yearly Average SSH and Argo data 0-1000 db Northward Transport v. Latitude ¼° ECCO Model Run Full Model Field & 1000 db Bathy Mask To test for sensitivity to lack of data in regions shallower than 1000 m, the ¼° ECCO model velocity field was masked out in regions with depths shallower than 1000 m. This mimics the effect of missing velocity data in these regions. Note that the two agree well between 38°N and 45°N. This suggest that in this region, the overturning is well confined to the deep ocean. Absolute SSH relative to the geoid computed using 2003-2007 absolute dynamic topography from Willis and Fu (2008) and AVISO SSH anomalies. Black dots show Argo profiles (and displacements, approximately) in a given year. Time series of northward geostrophic transport between the surface and 1000 db. Each point is a one-year average, even though the overturning is computed 2 times per year. Summary Observations of subsurface velocity and density profiles from Argo floats were combined with altimeter data to estimate the shallow, northward flowing limb of the Atlantic MOC. Between 38N and 45N, most of the transport is confined to the deep ocean, which is sampled by the Argo floats. Using the 2003-2007 time-mean circulation as a first guess, the interannual variability in the AMOC is estimated at these latitudes. Significant interannual variability is present as well as a slight trend toward decreasing transport between 2003 and 2008. Reference Willis J. K., L.-L. Fu (2008), Combining altimeter and subsurface float data to estimate the time-averaged circulation in the upper ocean, J. Geophys. Res., 113, C12017, doi:10.1029/2007JC004690.