Download
1 / 3
30 likes | 113 Vues
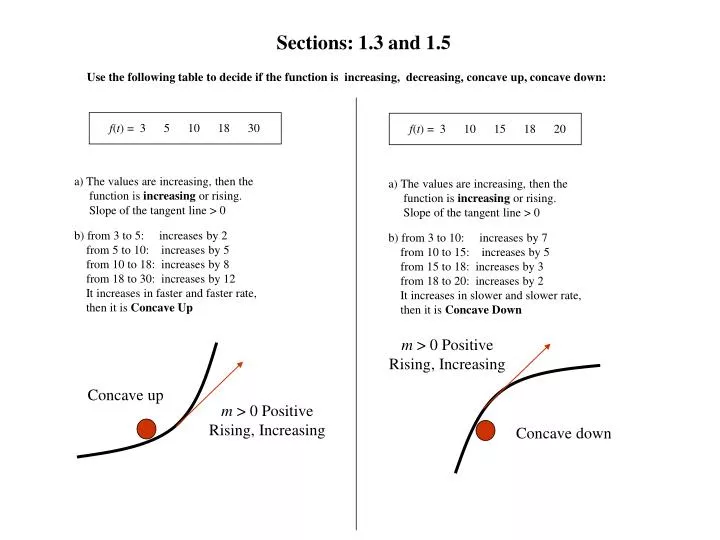
f ( t ) = 3 5 10 18 30 . f ( t ) = 3 10 15 18 20 . m > 0 Positive Rising, Increasing. Concave up. m > 0 Positive Rising, Increasing. Concave down. Sections: 1.3 and 1.5.

E N D
f(t) = 3 5 10 18 30 f(t) = 3 10 15 18 20 m > 0 PositiveRising, Increasing Concave up m > 0 PositiveRising, Increasing Concave down Sections: 1.3 and 1.5 Use the following table to decide if the function is increasing, decreasing, concave up, concave down: a) The values are increasing, then the function is increasing or rising. Slope of the tangent line > 0 a) The values are increasing, then the function is increasing or rising. Slope of the tangent line > 0 b) from 3 to 5: increases by 2 from 5 to 10: increases by 5 from 10 to 18: increases by 8 from 18 to 30: increases by 12 It increases in faster and faster rate, then it is Concave Up b) from 3 to 10: increases by 7 from 10 to 15: increases by 5 from 15 to 18: increases by 3 from 18 to 20: increases by 2 It increases in slower and slower rate, then it is Concave Down
f(t) = 30 18 10 5 2 f(t) = 20 18 15 10 3 m < 0 NegativeFalling, Decreasing m < 0 NegativeFalling, Decreasing Concave up Concave down Concave up, Concave down, Increasing, Decreasing Use the following table to decide if the function is increasing, decreasing, concave up, concave down:(notice that the tables are the same as the previous example, but in reverse order) a) The values are decreasing, then the function is decreasing or falling. Slope of the tangent line < 0 a) The values are decreasing, then the function is decreasing or falling. Slope of the tangent line < 0 b) from 30 to 18: decreases by 12 from 18 to 10: decreases by 8 from 10 to 5: decreases by 5 from 5 to 2: decreases by 3 It decreases in slower and slower rate, then it is Concave Up b) from 20 to 18: decreases by 2 from 18 to 15: decreases by 3 from 15 to 10: decreases by 5 from 10 to 3: decreases by 7 It decreases in faster and faster rate, then it is Concave Down
t f(t) t f(t) 0 1 2 3 4 4 6 8 10 12 0 2 4 6 8 12 9 6 3 0 t f(t) t f(t) 0 1 2 3 12 13.2 14.52 15.972 15 12 9.6 7.68 0 1 2 3 Linear Increase or DecreaseExponential Growth or Decay Linear Decreasey = mx + bm < 0 Linear Increasey = mx + bm > 0 Or: y = 2x + 4 ; (m = 2) Or: y = -1.5x + 12 ; (m = -1.5) Exponential GrowthP=P0(a)ta > 1 Exponential DecayP=P0(a)ta < 1 Or: P = 12(1.1)t ;(a = 1.1) Or: P = 15(0.8)t ;(a = 0.8)