Download
1 / 2
20 likes | 145 Vues
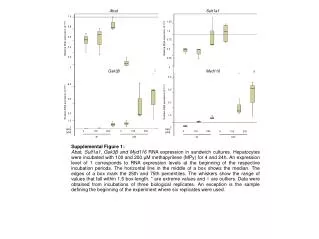
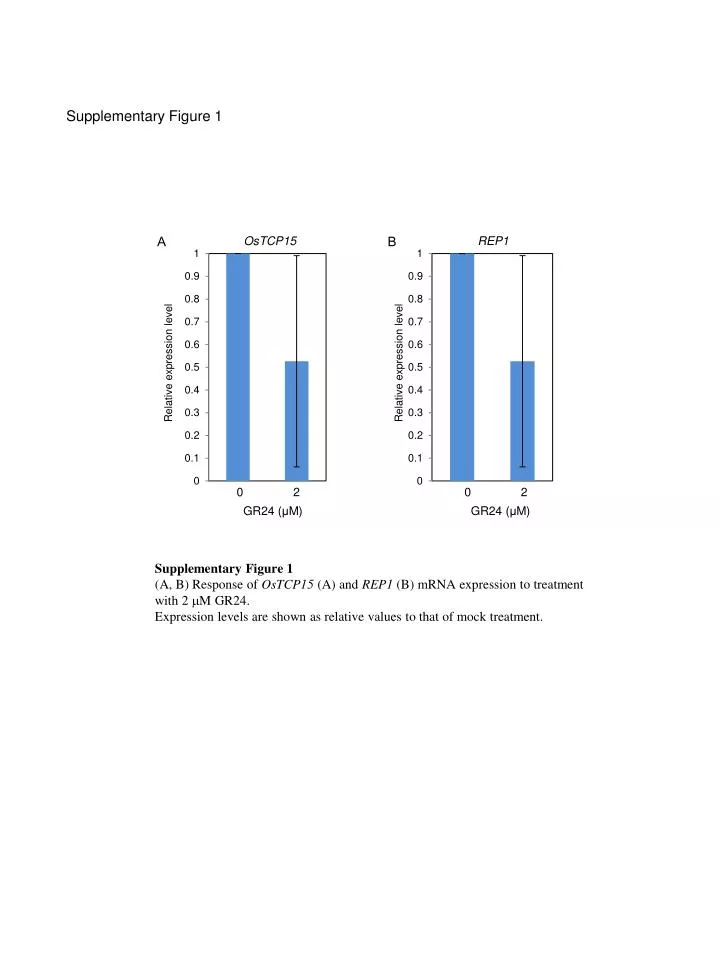
Supplementary Figure 1. OsTCP15. REP1. A. B. Relative expression level. Relative expression level. 0 2 GR24 ( μ M). 0 2 GR24 ( μ M). Supplementary Figure 1

E N D
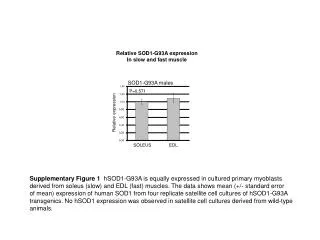
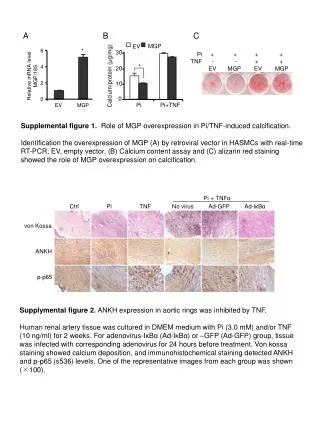
Supplementary Figure 1 OsTCP15 REP1 A B Relative expression level Relative expression level 0 2 GR24 (μM) 0 2 GR24 (μM) Supplementary Figure 1 (A, B) Response of OsTCP15 (A) and REP1 (B)mRNA expression to treatment with 2 M GR24. Expression levels are shown as relative values to that of mock treatment.
Supplementary Figure 2 A B OsTCP15 REP1 Relative expression level Relative expression level 0 1 5 10 BAP (μM) 0 1 5 10 BAP (μM) Supplementary Figure 2 (A, B) Response of OsTCP15 (A) and REP1 (B)mRNA expression to treatment with various concentrations of N6−benzylaminopurine (BAP). Expression levels are shown as relative values to that of mock treatment.