Download
1 / 10
170 likes | 421 Vues
Flooding Case Study - Boscastle. Boscastle. Flood Hydrographs. LO: To describe what a flood hydrograph shows and how it can be affected by the drainage basin. bbc footage. All will be able to name the features shown on a flood hydrograph

E N D
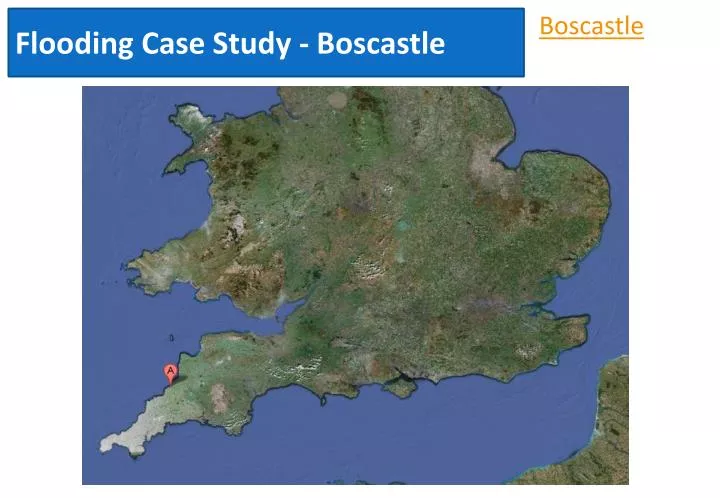
Flooding Case Study - Boscastle Boscastle
Flood Hydrographs LO: To describe what a flood hydrograph shows and how it can be affected by the drainage basin bbc footage All will be able to name the features shown on a flood hydrograph Most will be able to read data from a flood hydrograph Some will be able to describe how the stages in a flood hydrograph can affect people 2 hour hydrograph
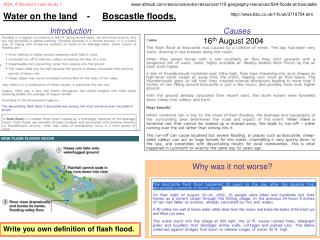
Hydrograph A hydrograph is a line that shows river discharge over a period of time. Hydrographs of rivers in flood help show the link between rainfall and river level. This helps people to predict possible floods.
Hydrographs • Label your copy of the hydrograph diagram. • Glue it in along with your definitions Discharge (cumecs) Peak Discharge Falling Limb Rising Limb Peak Rainfall
Lagtime 1. What is the peak rainfall on the Boscastle hydrograph? What time did it occur?2. What is the discharge of the river Valency before the rain (the baseflow)?3. What time was the peak discharge at Boscastle? How much water was in the river then?4. What is the lag time on the Boscastle hydrograph i.e. how long did it take the rain water to reach the river? Lag time is the amount of time it takes rain to get into a river. It can be affected by lots of things including; rock type, steepness of hills, vegetation slopes and whether the area is built up.
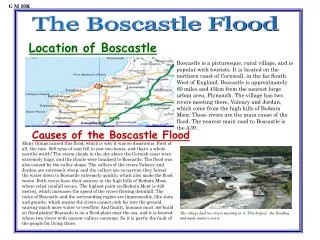
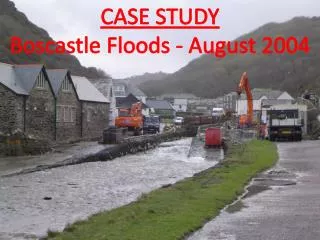
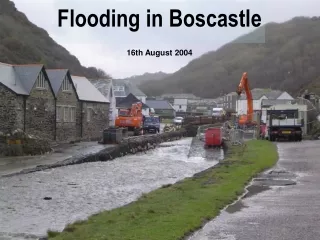
Boscastle Floods 16th August 2004 In the middle of their peak tourist season in 2004 Boscastle was Boscastle
Put the statements into their correct spot in the table Bare earth with few plants Permeable (water soaks into it) Steep valley sides Rural farmland Lots of trees and plants Impermeable (water doesn’t soaks in) Built up area – lots of tarmac Gentle valley sides