Download

1 / 65
650 likes | 662 Vues
TIPP and SEPP: Metagenomic Analysis using Phylogeny-Aware Profiles. Tandy Warnow and Erin Molloy Department of Computer Science The University of Illinois at Urbana-Champaign. Metagenomic taxonomic identification and phylogenetic profiling.

E N D
TIPP and SEPP: Metagenomic Analysis using Phylogeny-Aware Profiles Tandy Warnow and Erin Molloy Department of Computer Science The University of Illinois at Urbana-Champaign
Metagenomic taxonomic identification and phylogenetic profiling Metagenomics, Venter et al., Exploring the Sargasso Sea: Scientists Discover One Million New Genes in Ocean Microbes
1. What is this fragment? (Classify each fragment as well as possible.) 2. What is the taxonomic distribution in the dataset? (Note: helpful to use marker genes.) 3. What are the organisms in this metagenomic sample doing together? Basic Questions
This talk • SEPP (PSB 2012): SATé-enabled Phylogenetic Placement, and Ensembles of HMMs (eHMMs) • TIPP (Bioinformatics 2014): Applications of the eHMM technique to metagenomic abundance classification Both available at https://github.com/smirarab/sepp
Phylogenetic Placement Input: Backbone alignment and tree on full-length sequences, and a set of homologous querysequences (e.g., reads in a metagenomic sample for the same gene) Output: Placement of query sequences on backbone tree Phylogenetic placement can be used inside a pipeline, after determining the genes for each of the reads in the metagenomic sample.
Marker-based Taxon Identification Fragmentary sequences from some gene Full-length sequences for same gene, and an alignment and a tree ACCG CGAG CGG GGCT TAGA GGGGG TCGAG GGCG GGG • . • . • . ACCT AGG...GCAT TAGC...CCA TAGA...CTT AGC...ACA ACT..TAGA..A
Input S1 = -AGGCTATCACCTGACCTCCA-AA S2 = TAG-CTATCAC--GACCGC--GCA S3 = TAG-CT-------GACCGC--GCT S4 = TAC----TCAC--GACCGACAGCT Q1 = TAAAAC S1 S2 S3 S4
Align Sequence S1 = -AGGCTATCACCTGACCTCCA-AA S2 = TAG-CTATCAC--GACCGC--GCA S3 = TAG-CT-------GACCGC--GCT S4 = TAC----TCAC--GACCGACAGCT Q1 = -------T-A--AAAC-------- S1 S2 S3 S4
Place Sequence S1 = -AGGCTATCACCTGACCTCCA-AA S2 = TAG-CTATCAC--GACCGC--GCA S3 = TAG-CT-------GACCGC--GCT S4 = TAC----TCAC--GACCGACAGCT Q1 = -------T-A--AAAC-------- S1 S2 S3 S4 Q1
Phylogenetic Placement in 2011 • Align each query sequence to backbone alignment • HMMER (Finn et al., NAR 2011) • PaPaRa (Berger and Stamatakis, Bioinformatics 2011) • Place each query sequence into backbone tree • pplacer (Matsen et al., BMC Bioinformatics, 2011) • EPA (Berger and Stamatakis, Systematic Biology 2011) Note: pplacer and EPA solve same problem (maximum likelihood placement under standard sequence evolution models)
HMMER vs. PaPaRa Alignments 0.0 Increasing rate of evolution
Input S1 = -AGGCTATCACCTGACCTCCA-AA S2 = TAG-CTATCAC--GACCGC--GCA S3 = TAG-CT-------GACCGC--GCT S4 = TAC----TCAC--GACCGACAGCT Q1 = TAAAAC S1 S2 S3 S4
Align Sequence using HMMER S1 = -AGGCTATCACCTGACCTCCA-AA S2 = TAG-CTATCAC--GACCGC--GCA S3 = TAG-CT-------GACCGC--GCT S4 = TAC----TCAC--GACCGACAGCT Q1 = -------T-A--AAAC-------- S1 S2 S3 S4
Place Sequence using pplacer S1 = -AGGCTATCACCTGACCTCCA-AA S2 = TAG-CTATCAC--GACCGC--GCA S3 = TAG-CT-------GACCGC--GCT S4 = TAC----TCAC--GACCGACAGCT Q1 = -------T-A--AAAC-------- S1 S2 S3 S4 Q1
What is HMMER+pplacer? • HMMER (Finn et al., NAR 2011) is used to add the read s into the backbone alignment, thus producing an “extended alignment”. HMMER is based on profile Hidden Markov Models (profile HMMs). • pplacer (Matsen et al. BMC Bioinformatics 2010) is used to add read s into the best location in the tree T. pplacer is based on phylogenetic sequence evolution models (e.g., GTR), and uses maximum likelihood.
A general topology for a profile HMM From http://codecereal.blogspot.com/2011/07/protein-profile-with-hmm.html
Profile Hidden Markov Models • Profile HMMs are probabilistic generative models to represent multiple sequence alignments. • HMMER software suite can • Build a profile HMM given a multiple sequence alignment A • Use the profile HMM to add a sequence s into A, and return the “probability” that the HMM generated s • In other words, profile HMMs can be used to compute extended alignments, and score them!
Input S1 S2 S1 = -AGGCTATCACCTGACCTCCA-AA S2 = TAG-CTATCAC--GACCGC--GCA S3 = TAG-CT-------GACCGC--GCT S4 = TAC----TCAC--GACCGACAGCT Q1 = TAAAAC S3 S4
Align Sequence using HMMER S1 S2 S1 = -AGGCTATCACCTGACCTCCA-AA S2 = TAG-CTATCAC--GACCGC--GCA S3 = TAG-CT-------GACCGC--GCT S4 = TAC----TCAC--GACCGACAGCT Q1 = -------T-A--AAAC-------- S3 S4 Build a profile HMM for the backbone alignment Compute a maximum likelihood path through the profile HMM for Q1 and use it to compute the extended alignment. Note the maximum likelihood score for the alignment!
What is pplacer? • pplacer: software developed by Erick Matsen and colleagues. See http://matsen.fhcrc.org/pplacer/ • Input: read s, alignment A (on S and s), tree on S • Output: • “Best” location to add s in T (under maximum likelihood). • For every edge e in T, the value p(e) for the probability for s being placed on e (these probabilities add up to 1)
Place Sequence using pplacer S1 S2 S1 = -AGGCTATCACCTGACCTCCA-AA S2 = TAG-CTATCAC--GACCGC--GCA S3 = TAG-CT-------GACCGC--GCT S4 = TAC----TCAC--GACCGACAGCT Q1 = -------T-A--AAAC-------- S3 S4 For every edge in T, let Te be the tree created by adding Q1 to that edge. Compute the maximum likelihood (ML) score of the tree Te for the extended alignment. (Use the ML scores to assign probabilities p(e) to all edges e!) Return Te that has the best ML score.
Place Sequence using pplacer S1 S2 S1 = -AGGCTATCACCTGACCTCCA-AA S2 = TAG-CTATCAC--GACCGC--GCA S3 = TAG-CT-------GACCGC--GCT S4 = TAC----TCAC--GACCGACAGCT Q1 = -------T-A--AAAC-------- 0.03 0.4 0.05 0.02 0.5 S3 S4 For every edge in T, let Te be the tree created by adding Q1 to that edge. Compute the maximum likelihood (ML) score of the tree Te for the extended alignment. (Use the ML scores to assign probabilities p(e) to all edges e!)
Place Sequence using pplacer S1 S2 S1 = -AGGCTATCACCTGACCTCCA-AA S2 = TAG-CTATCAC--GACCGC--GCA S3 = TAG-CT-------GACCGC--GCT S4 = TAC----TCAC--GACCGACAGCT Q1 = -------T-A--AAAC-------- 0.03 0.4 0.05 0.02 0.5 S3 S4 For every edge in T, let Te be the tree created by adding Q1 to that edge. Compute the maximum likelihood (ML) score of the tree Te for the extended alignment. (Use the ML scores to assign probabilities p(e) to all edges e!) Return Te that has the best ML score.
Place Sequence using pplacer S1 S2 S1 = -AGGCTATCACCTGACCTCCA-AA S2 = TAG-CTATCAC--GACCGC--GCA S3 = TAG-CT-------GACCGC--GCT S4 = TAC----TCAC--GACCGACAGCT Q1 = -------T-A--AAAC-------- S3 S4 Q1 For every edge in T, let Te be the tree created by adding Q1 to that edge. Compute the maximum likelihood (ML) score of the tree Te for the extended alignment. (Use the ML scores to assign probabilities p(e) to all edges e!) Return Te that has the best ML score.
HMMER vs. PaPaRa Alignments 0.0 Increasing rate of evolution
Or 2 HMMs? HMM 1 HMM 2
Or 4 HMMs? HMM 1 HMM 2 HMM 3 HMM 4
SEPP Design To insert query sequence Q1 into backbone tree T Represent the backbone MSA with a collection of profile HMMs, based on maximum ”alignment subset size” Score Q1 against every profile HMM in the collection The best scoring HMM is used to compute the extended alignment Use pplacer to add Q1 into tree T (restricted to ”subtree” based on maximum ”placement subset size”)
Or 2 HMMs? HMM 1 HMM 2
Or 4 HMMs? HMM 1 HMM 2 HMM 3 HMM 4
SEPP Parameter Exploration Alignment subset size and placement subset size impact the accuracy, running time, and memory of SEPP: Small alignment subset sizes best Large placement subset size best 10% rule (both subset sizes 10% of backbone) had best overall performance
SEPP (10%-rule) on simulated data 0.0 0.0 Increasing rate of evolution
SEPP and eHMMs An ensemble of HMMs provides a better model of a multiple sequence alignment than a single HMM, and is better able to • detect homology between full length sequences and fragmentary sequences • add fragmentary sequences into an existing alignment especially when there are many indels and/or substitutions.
Metagenomic Taxon Identification Objective: classify short reads in a metagenomic sample
Objective: Distribution of the species (or genera, or families, etc.) within the sample. For example: The distribution of the sample at the species-level is: 50% species A 20% species B 15% species C 14% species D 1% species E Abundance Profiling
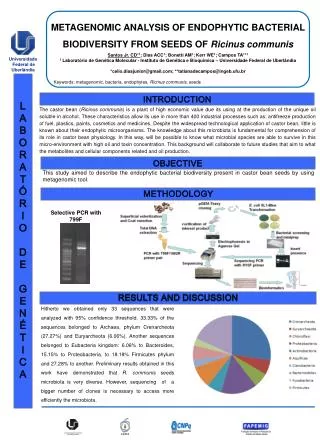
TIPP (https://github.com/smirarab/sepp) TIPP (Nguyen, Mirarb, Liu, Pop, and Warnow, Bioinformatics 2014), marker-based method that only characterizes those reads that map to the Metaphyler’s marker genes TIPP pipeline • Uses BLAST to assign reads to marker genes • Computes UPP/PASTA reference alignments • Uses reference taxonomies, refined to binary trees using reference alignment • Modifies SEPP by considering statistical uncertainty in the extended alignment and placement within the tree. • Can consider more than one extended alignment • Can consider more than optimal placement in the tree for each extended alignment • Assign taxonomic label based on MRCA of all selected placements for all selected extended alignment
TIPP (https://github.com/smirarab/sepp) TIPP (Nguyen, Mirarb, Liu, Pop, and Warnow, Bioinformatics 2014), marker-based method that only characterizes those reads that map to the Metaphyler’s marker genes TIPP pipeline • Uses BLAST to assign reads to marker genes • Computes UPP/PASTA reference alignments • Uses reference taxonomies, refined to binary trees using reference alignment • Modifies SEPP by considering statistical uncertainty in the extended alignment and placement within the tree. • Can consider more than one extended alignment • Can consider more than optimal placement in the tree for each extended alignment • Assign taxonomic label based on MRCA of all selected placements for all selected extended alignment
TIPP (https://github.com/smirarab/sepp) TIPP (Nguyen, Mirarb, Liu, Pop, and Warnow, Bioinformatics 2014), marker-based method that only characterizes those reads that map to the Metaphyler’s marker genes TIPP pipeline • Uses BLAST to assign reads to marker genes • Computes UPP/PASTA reference alignments • Uses reference taxonomies, refined to binary trees using reference alignment • Modifies SEPP by considering statistical uncertainty in the extended alignment and placement within the tree. • Can consider more than one extended alignment • Can consider more than optimal placement in the tree for each extended alignment • Assign taxonomic label based on MRCA of all selected placements for all selected extended alignment
TIPP (https://github.com/smirarab/sepp) TIPP (Nguyen, Mirarb, Liu, Pop, and Warnow, Bioinformatics 2014), marker-based method that only characterizes those reads that map to the Metaphyler’s marker genes TIPP pipeline • Uses BLAST to assign reads to marker genes • Computes UPP/PASTA reference alignments • Uses reference taxonomies, refined to binary trees using reference alignment • Modifies SEPP by considering statistical uncertainty in the extended alignment and placement within the tree. • Can consider more than one extended alignment • Can consider more than one placement in the tree for each extended alignment • Assign taxonomic label based on MRCA of all selected placements for all selected extended alignments
TIPP Design (Step 4) • Input: marker gene reference alignment (computed using PASTA, RECOMB 2014), species taxonomy, alignment support threshold (default 95%) and placement support threshold (default 95%) • For each marker gene, and its associated bin of reads: • Builds eHMM to represent the MSA • For each read: • Use the eHMM to produce a set of extended MSAs that include the read, sufficient to reach the specified alignment support threshold. • For each extended MSA, use pplacer to place the read into the taxonomy optimizing maximum likelihood and identify all the clades in the tree with sufficiently high likelihood to meet the specified placement support threshold. (Note – this will be a single clade if the support threshold is at strictly greater than 50%.) • Taxonomically characterize each read at the MRCA of these clades.
TIPP Design (Step 4) • Input: marker gene reference alignment (computed using PASTA, RECOMB 2014), species taxonomy, alignment support threshold (default 95%) and placement support threshold (default 95%) • For each marker gene, and its associated bin of reads: • Builds eHMM to represent the MSA • For each read: • Use the eHMM to produce a set of extended MSAs that include the read, sufficient to reach the specified alignment support threshold. • For each extended MSA, use pplacer to place the read into the taxonomy optimizing maximum likelihood and identify all the clades in the tree with sufficiently high likelihood to meet the specified placement support threshold. (Note – this will be a single clade if the support threshold is at strictly greater than 50%.) • Taxonomically characterize each read at the MRCA of these clades.
TIPP Design (Step 4) • Input: marker gene reference alignment (computed using PASTA, RECOMB 2014), species taxonomy, alignment support threshold (default 95%) and placement support threshold (default 95%) • For each marker gene, and its associated bin of reads: • Builds eHMM to represent the MSA • For each read: • Use the eHMM to produce a set of extended MSAs that include the read, sufficient to reach the specified alignment support threshold. • For each extended MSA, use pplacer to place the read into the taxonomy optimizing maximum likelihood and identify all the clades in the tree with sufficiently high likelihood to meet the specified placement support threshold. (Note – this will be a single clade if the support threshold is at strictly greater than 50%.) • Taxonomically characterize each read at the MRCA of these clades.
TIPP Design (Step 4) • Input: marker gene reference alignment (computed using PASTA, RECOMB 2014), species taxonomy, alignment support threshold (default 95%) and placement support threshold (default 95%) • For each marker gene, and its associated bin of reads: • Builds eHMM to represent the MSA • For each read: • Use the eHMM to produce a set of extended MSAs that include the read, sufficient to reach the specified alignment support threshold. • For each extended MSA, use pplacer to place the read into the taxonomy optimizing maximum likelihood and identify all the clades in the tree with sufficiently high likelihood to meet the specified placement support threshold. (Note – this will be a single clade if the support threshold is at strictly greater than 50%.) • Taxonomically characterize each read at the MRCA of these clades.
TIPP Design (Step 4) • Input: marker gene reference alignment (computed using PASTA, RECOMB 2014), species taxonomy, alignment support threshold (default 95%) and placement support threshold (default 95%) • For each marker gene, and its associated bin of reads: • Builds eHMM to represent the MSA • For each read: • Use the eHMM to produce a set of extended MSAs that include the read, sufficient to reach the specified alignment support threshold. • For each extended MSA, use pplacer to place the read into the taxonomy optimizing maximum likelihood and identify all the clades in the tree with sufficiently high likelihood to meet the specified placement support threshold. (Note – this will be a single clade if the support threshold is at strictly greater than 50%.) • Taxonomically characterize each read at the MRCA of these clades.