Download
1 / 1

E N D
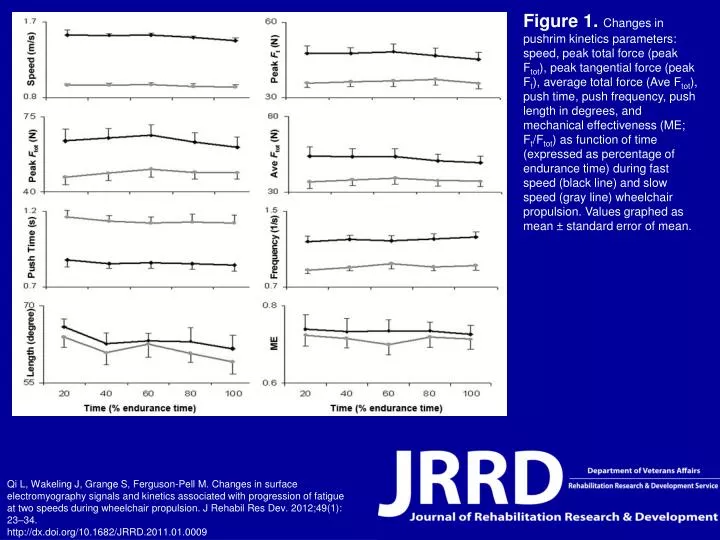
Figure 1. Changes in pushrim kinetics parameters: speed, peak total force (peak Ftot), peak tangential force (peak Ft), average total force (Ave Ftot), push time, push frequency, push length in degrees, and mechanical effectiveness (ME; Ft/Ftot) as function of time (expressed as percentage of endurance time) during fast speed (black line) and slow speed (gray line) wheelchair propulsion. Values graphed as mean ± standard error of mean. Qi L, Wakeling J, Grange S, Ferguson-Pell M. Changes in surface electromyography signals and kinetics associated with progression of fatigue at two speeds during wheelchair propulsion. J Rehabil Res Dev. 2012;49(1): 23–34.http://dx.doi.org/10.1682/JRRD.2011.01.0009