Download
1 / 48
480 likes | 812 Vues
The UK National Statistics Socio-economic Classification and an Illustration of its Uses in Research on Health Inequalities. David Rose Institute for Social and Economic Research University of Essex. Overview. UK Government and health inequalities The ESRC Review of Government SECs

E N D
The UK National Statistics Socio-economic Classification and an Illustration of its Uses in Research on Health Inequalities David Rose Institute for Social and Economic Research University of Essex
Overview • UK Government and health inequalities • The ESRC Review of Government SECs • Conceptual basis of NS-SEC (4) Criterion validation of NS-SEC (5) Construct validation of NS-SEC in relation to health data
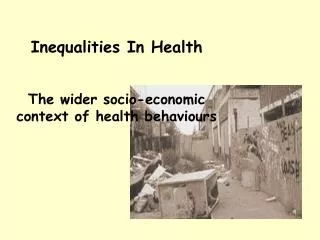
Health Inequalities and Government (1) Measuring and monitoring socio-economic differentials in mortality and other health inequalities in the UK has been a key part of the work of the office responsible for the registration of deaths since the establishment of the General Register Office (GRO) in 1837. The GRO has since been subsumed within the Office for National Statistics (ONS) and it is now ONS that carries on the tradition of reporting on health variations today. This role continues to be of major importance as health inequalities are as much a public health issue today as they were 170 years ago, when the GRO was set up.
Health Inequalities and Government (2) The earliest analyses of mortality differences were undertaken by reference to occupation and industry. However, from the beginning of the twentieth century, the development of RGSC gave a clearer framework for identifying and understanding health differentials within the population.
Health Inequalities and Government (3) It was demonstrated that there was a class gradient in health – in particular in mortality rates – and despite the creation of the National Health Service in 1948, class inequalities in health and life expectancy have persisted. Overall, those in ‘partly skilled’ and ‘unskilled’ occupations in RGSC IV and V had far higher mortality rates and lower life expectancy than those in professional and managerial occupations in Classes I and II.
Social Class based on Occupation I Professional occupations II Managerial and technical occupations IIIN Skilled occupations, non-manual IIIM Skilled occupations, manual IV Partly skilled occupations V Unskilled occupations
Health Inequalities and Government (4) The Acheson Inquiry 1998 “The weight of scientific evidence supports a socio-economic explanation of health inequalities.” “The research task is to trace the paths from social structure, represented by SES, through to inequalities in health.” “Health inequalities are the outcome of causal chains which run back into and from the basic structure of society.”
Problems with RGSC (1) • Difficult to interpret in use • Difficult to maintain No coherent conceptual basis Therefore:
Problems with RGSC (2) • Skill • Manual/Non-manual divide Use outmoded ‘industrial’ distinctions
Registrar General’s Social Classes Simon Szreter (1984) “The RGSC might best be classified as a ‘pseudo-analytical’ construction. (It never had any relationship to) a recognised, coherent and examinable body of social theory.” “(The propositions that underlie RGSC are those) of nineteenth century anthropometric and biometric ‘science’, only with the explicit commitment to a naturalistic and hereditarian theory of ultimate explanation removed.”
Registrar General’s Social Classes Simon Szreter (1984) “RGSC is ‘the ‘Crude Inequality Index’.”
Tasks for ESRC Review To create a single occupationally-based SEC which would be: • Clear conceptually • Analytically transparent • Thus easy to maintain and interpret • ‘Nested’ • Bridgeable to RGSC • Applicable to a wide range of data
Conceptual basis for the NS-SEC(Goldthorpe) • Employment relations and conditions are central to delineating the structure of socio-economic positions in modern societies
Basic SEC Positions EMPLOYERS SELF-EMPLOYED WORKERS EMPLOYEES EXCLUDED The Derivation of the NS-SEC
Typical elements of the Labour Contract • Short-term exchange of money for effort • Payment by the time or piece • No occupational pension or health scheme • Contract easily terminated • Low level of job security
Typical elements of the Service Relationship • Long-term exchange of service for compensation • Greater job security and employability • Salary • Incremental or similar payment systems • Occupational pension and health schemes • Greater control over the job and thus trust between employer and employee
Dimensions of work as sources of contractual hazard Specificity of human assets high Difficulty of monitoring low high low
Dimensions of work as sources of contractual hazard, forms of contract and class locations Specificity of human assets high 1 5 Service relationship mixed Difficulty of monitoring low high mixed Labour contract 3 low 7
Basic SEC Positions EMPLOYERS SELF-EMPLOYED WORKERS EMPLOYEES EXCLUDED Form of employment regulation Service Intermediate Labour Large Small Self-employed Professionals managers Intermediate Supervisors etc Semi-routine, routine Never worked Long-term Unemployed The Derivation of the NS-SEC (1.1) (1,2,4) (4) (1.1,1.2,2) (3,5) (6,7) (8) (8)
1 Higher managerial and professional occupations (1.1 Large employers and higher managerial) (1.2 Higher professional) 2 Lower managerial and professional occupations 3 Intermediate occupations 4 Small employers and own account workers 5 Lower supervisory and technical occupations 6 Semi-routine occupations 7 Routine occupations 8 Never worked and long-term unemployed The NS-SEC
Collapsing the Operational Version The 34 categories and sub-categories may be collapsed into • a ‘nine’ class variable • an eight class variable (the ‘official’ NS-SEC) • a seven class variable • a five class variable • a three class variable
Summary (1) • NS-SEC is first a conceptual construction (hence NS-SEC is a schema) • To operationalise the schema we need an algorithm to a detailed set of occupation-by-employment status units
Summary (2) How well the NS-SEC schema is operationalised depends upon two things: (a) how closely the basic occupational and employment status classifications available map onto the categories of the NS-SEC (i.e. adequacy of the derivation matrix) (b) how much information is available relevant to the construction of the algorithm linking these classifications to the schema (i.e. issues of criterion validity)
Creating the NS-SEC Data required on • occupation • employment status • establishment size These then linked via the NSSEC derivation matrix of OUG by ES units to NSSEC classes
Reduced & Simplified versions of NS-SEC Reduced NS-SEC - if no information on establishment size Simplified NS-SEC - if data only on occupation
Validation studies (a) CRITERION VALIDATION Do measures of employment relations discriminate between the categories of the NS-SEC? (b) CONSTRUCT VALIDATION How well does the NS-SEC explain variance in theoretically relevant dependent variables?
Criterion validation MEASURES OF EMPLOYMENT RELATIONS 1 form of remuneration 2 career opportunities 3 autonomy with regard to time Three conceptually separable respects in which employment relations are differentiated according to whether a service relationship or labour contract prevails
Construct validation • NS-SEC and Health Data • NS-SEC and Labour Market Data
Table 8.6: SMRs by NS-SEC for Our Healthier Nation causes of death, men aged 20-64, England and Wales 1991-93
Figure 8.2: SMRs by NS-SEC, men aged 20-64, England and Wales 1991-93
Figure 8.4: Age-specific mortality rates by NS-SEC, men aged 20-64, England and Wales 1991-93
Table 8.8: Stillbirth and infant mortality rates by NS-SEC, England and Wales, 1996
Table 9.5: Odds ratios and 95% confidence intervals of low birth weight and very low birth weight for classes of the National Statistics Socio-economic Classification for live, singleton births within marriage 1996-98 England and Wales (n=114,382)
Table 10.3: Logistic regression odds ratios of NS-SEC inequalities in health for men and women aged 18-59:separating the long-term unemployed and never worked
Table 10.4: Logistic regression odds ratios of NS-SEC inequalities in health for men and women aged 18-59:classifying the long-term unemployed by last main occupation
Causal narratives (1) • NS-SEC offers not improved statistical associations over other ‘SES’ measures, but the possibility of explaining the associations we find; • NS-SEC is measuring employment relations and conditions, i.e. aspects of the work situation and the employment contract.
Causal narratives (2) • So we can construct causal narratives which specify how the NS-SEC links to a range of outcomes via a variety of intervening variables; • Not the case for the former government SECs, since it is not clear what they measure. They may show statistical associations with dependent variables of interest, but they do not lend themselves to causal explanations. Same for e.g. housing tenure, car access etc.
Causal narratives (3) One of the major uses of SECs has been in studies of fertility, morbidity and mortality, i.e. as a means of obtaining a macro or societal perspective on these issues; NS-SEC defines structural positions which can be seen conceptually to exist independently of the individuals who occupy those positions at any particular time. The positions condition and shape the lives of their occupants; We are therefore linking health with social organisation or social structure.
The Whitehall Studies The Whitehall Studies: growing evidence that the amounts of control and autonomy a person has at work are important factors in explaining heart disease; The ‘prospective perspective’ associated with secure, career employment among top managers and professionals is associated with greater control and autonomy at work, more self-esteem, greater self-care with regard to factors such as diet and exercise, more choice over medical treatment and so on.
Advantages of the NS-SEC • Conceptually clear and rigorous • Simple to create • Flexible in use • Improved classification of women • Easier to maintain • Better explanatory tool
Possible ESeC ‘Classes’ (Level 1) • Large employers, higher managerial and professional occupations • Lower managerial and professional occupations • Intermediate occupations • Small employers and own account workers • Self-employed in agriculture etc • Lower supervisory and technician occupations • Lower services etc occupations • Lower technical occupations • Routine occupations • Never worked and long-term unemployed
Basic SEC Positions EMPLOYERS SELF-EMPLOYED WORKERS EMPLOYEES EXCLUDED Form of employment regulation Large Small SERVICE RELATIONSHIP MIXED LABOUR CONTRACT Professional managerial, etc Clerical Sales Services Super- Serv- Lower routine visory/ ices technical Technician Never worked Unemp-loyed Higher Lower Higher prof Lower prof/ Tech Other Higher prof Lower prof/ Tech Agric etc Other Prof Man Prof /Tech Man Sup Higher prof Lower prof/ Tech Agric etc Other 1 1 1 1 2 5 4 1 2 5 4 1 1 2 2 2 3 3 3 6 7 8 9 10 10 The conceptual derivation of ESeC
Underlying ESeC ‘Socio-economic Groups’ (Level 2) Class 1 Large employers, higher managerial and professional occupations 11. Employers (other than in agriculture) with 10+ employees 12. Farmers with full-time employees (or ‘large business’ farmers) 13. Higher managerial occupations 14. Higher professional occupations (employees) 15. Self-employed professional occupations