Download
1 / 27
270 likes | 456 Vues
Subsurface Flows from ring-diagram analysis. Irene Gonz á lez Hern á ndez National Solar Observatory Tucson, Arizona. Subsurface flows from ring-diagram analysis. Ring-diagrams technique Differential rotation Meridional circulation Dynamics of active regions and filaments

E N D
Subsurface Flows from ring-diagram analysis Irene González Hernández National Solar Observatory Tucson, Arizona
Subsurface flows from ring-diagram analysis • Ring-diagrams technique • Differential rotation • Meridional circulation • Dynamics of active regions and filaments • Results at different heights • Future work and conclusions
1664 min 16o Ring-diagrams technique • Hill, F; 1988, ApJ,333,996 • Patrón, J.; Hill, F.;Rhodes, E.J.,Jr.;Korzennik,S. G. and Cacciani,A., 1995, ApJ, 455,746 • González Hernández, I.; 1998 PhD tesis, University of La Laguna • González Hernández, I.; Patrón,J.; RocaCortés, T.; Bogart,R.S.; Hill,F.; Rhodes,E.J.,Jr.,2000, ApJ
Flows from rings: synoptic maps Courtesy of R. Komm
Differential Rotation Radial variation of the mean rotation rate, shifted to give a zero rate at the surface, for global inversions (curves mark error bounds) of MDI data and local inversions of MDI (filled circles) and GONG (open diamonds) data at latitudes 0(top left), 15(top right), 30 (bottom left) and 45 (bottom right). Howe, R. et al., 2006, Solar Physics ,235,1.
Zonal torsional oscillation Howe, R. et al., 2006, Solar Physics, 235,1. Zonal flow residuals from global helioseismology and local helioseismology (ring-diagrams) at 0.99Rsun
North-South asymmetry • The latitudinal variation is most likely a consequence of the solar-cycle variation of the zonal flow, the torsional oscillation pattern. • The zonal flow is predominantly faster in the southern hemisphere that in the northern one. This differences increase with latitude about 25-degrees, and with depth. Zaatri, A. et al, 2006, Solar Physics, 236,227 Temporal variation of the zonal flow in the Northern (dark grey) and Southern (light grey) hemisphere at four latitudes and four depths. The surface rotation rate has been subtracted (Snodgrass, 1984). The line thickness represents about two standard deviations of the formal undertainty. The top row shows, for comparison, the time scale in Carrington Rotations.
Courtesy of E. McDonald Meridional Circulation and Dynamo Models • Dikpati, Mausumi; Gilman, Peter A. "Flux-Transport Dynamos with α-Effect from Global Instability of Tachocline Differential Rotation: A Solution for Magnetic Parity Selection in the Sun". 2001, ApJ, 559, 428 • Gilman, P.A and Miesch, M. "Limits to Penetration of Meridional Circulation Below the Solar Convection Zone“, 2004, ApJ, 611, 568. • Giles, P., 2000, PhD Thesis, Stanford University. • Haber, Deborah A.; Hindman, Bradley W.; Toomre, Juri; Bogart, Richard S.; Larsen, Rasmus M.; Hill, Frank. "Evolving Submerged Meridional Circulation Cells within the Upper Convection Zone Revealed by Ring-Diagram Analysis". 2002, ApJ,570, 855 • McDonald, E.; Dikpati, M. "Evolution of Large-scale Solar Magnetic Fields in the Presence of a Multi-cell Meridional Flow". 2004,American Astronomical Society Meeting 204, #53.06
A quick history of Meridional Circulation from rings • González Hernández, I, Patrόn, J, Bogart, R. S. and the SOI Ring Diagram Team, 1999, ApJ 510, L153 • Basu, S. and Antia, H.M, 2002 Proceedings of the SOHO 11 Symposium 2003, ApJ 585, 553 • Haber, D.A., Hindman, B. W.,Toomre, J., Bogart, R.S., Larsen, R.M., Hill, F.,2002, ApJ 570, 855. • González Hernández, I., Komm, R.,Hill,F.,Howe,R., Corbard, T. and Haber, D.A., 2006, ApJ 638, 576 • Zaatri, A., Komm,R., Gonzalez Hernandez, I., Howe, R. and Corbard, T., 2006, SoPh 236, 227
Meridional Circulation Basu & Antia, 2003
Meridional Circulation Haber et al, 2002
Meridional Circulation González Hernández et al, 2006
Meridional Circulation González Hernández et al, 2006
Meridional Circulation Zaatri et al, 2006
Meridional Circulation Zaatri et al, 2006
Recent results from MDI Haber, D. et al., 2006
Meridional Circulation from small patches Courtesy of B. Hindman and D. Haber
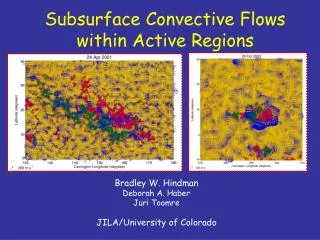
Subsurface flows and their relation to surface magnetic activity NOAA10069: 300o Longitude, −7.5o Latitude Courtesy of R. Komm
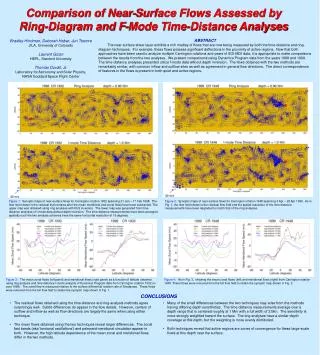
Flows in filaments Daily high-resolution flowmaps obtained using 4。-diametertiles. The maps spanfour consecutive days: (a)2002 March 30, (b)2002 March 31, (c)2002 April 1, and(d) 2002 April 2.Regions of opposite magneticpolarity, as determined fromMDI magnetograms, are indicatedin green and red.The dark contour lineshows the position ofa filament as observedin BBSO H images.On March 31when BBSOimages were unavailable, thecontour from the previousday is indicated witha dashed line. Fourlong-lived convection cells spanthe location of thefilament and are markedwith numerals IミIV (inwhite). The filament runsthrough the center ofthese cells and theapparent flow along theneutral line is complicated.The widening of thefilament over the spanof the four daysis probably due toprojection of the filamentagainst the solar diskas the region rotatesacross the Sun's visiblesurface. Hindman, B., Haber, D. and Toomre, J. ApJ, 2006, 653, 725
Flows in filaments Daily high-resolution flow mapsobtained using 2。-diameter tiles,zoomed in to coverthe region outlined withthe white dashed boxin previous fig. The mapsspan the same fourdays displayed in the previous fig:(a) 2002 March 30,(b) 2002 March 31,(c) 2002 April 1,and (d) 2002 April2. The finer resolutionavailable in these mapsindicate that there isa complex interaction betweenthe flow cells andphotospheric magnetism. Hindman, B., Haber, D. and Toomre, J. ApJ, 2006, 653, 725
Flows at different heights Subsurface flow maps for Jan 18, 2003(left) and Jan 19, 2003 (right). Blue arrows show flows obtained from the Ni line and red from the K line. Differences Jain, K. et al, 2006
Flows from untracked regions Courtesy of R Bogart, C Rabello-Soares and S. Basu
Flows from untracked regions Courtesy of R Bogart, C Rabello-Soares and S. Basu
The future • GONG/MDI • 3-Dimensional inversions • Large scale flows: • Foreshortening / Projection • Other high latitude effects • Flows in active areas • Effect of magnetic activity fitting method • More analysis • HMI (Solar Dynamics Observatory) • VIM (Solar Orbiter)
Conclusions Ring analysis has made a significant contribution to the study of large scale flows from the surface to approx. 30Mm. New results confirm the solar cycle dependence of meridional circulation close to the surface found by previous works, but show almost no dependence at deeper layers. Surface activity effect is being investigated. Multi-cell circulation needs to be confirmed HRRA: Flows in active regions and filaments Several problems of the technique need to be addressed We are limited in latitude to +/- 50 degrees Higher resolution observations (HMI) Observations off the ecliptic (Solar Orbiter mission) The stellar connection: “Try to use dynamo models that do “well” in the solar case” (M. Rempel)