Download
1 / 52
520 likes | 668 Vues
Forecasts and Responsibilities in the 1997 Red River Floods. Roger A. Pielke, Jr. Center for Science and Technology Policy Research University of Colorado/CIRES roger.pielke@colorado.edu COMET Boulder, CO 3 December 2001. Outline I. Introduction II. Context III. 1997 Red River Floods

E N D
Forecasts and Responsibilities in the1997 Red River Floods Roger A. Pielke, Jr. Center for Science and Technology Policy Research University of Colorado/CIRES roger.pielke@colorado.edu COMET Boulder, CO 3 December 2001
Outline I. Introduction II. Context III. 1997 Red River Floods IV. Lessons VI. Concluding Thoughts
“We only learn from experience that while the forecasting efforts of a charlatan are judged by their occasional successes, it is the occasional failures of a governmental department which are remembered against it.” Sir Gilbert Walker (1935)
Some definitions: Uncertainty: Occurs when more than one outcome is consistent with expectations Pielke (2001) Communication: Who, say What, to Whom, How, and with What Effect Lasswell (1948) Forecast: A combination of an EVENT and a PROBABILITY Fischoff (1994)
“The decision making process is best served when uncertainty is communicated as precisely as possible, but no more precisely than warranted" (Budescu and Wallsten 1987, 76)
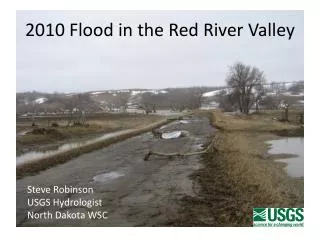
1997 Red River Floods • US$1-$2 billion in total damages • Greatest per capita losses in US history • 4 deaths (none in Grand Forks)
“With proper advance notice we could have protected the city to almost any elevation . . . if we had known [the final flood crest in advance], I'm sure that we could have protected a majority of the city” Grand Forks city engineer Ken Vein 4 May 1997
"They [NWS] missed it, and they not only missed it, they blew it big” Lynn Stauss, Mayor East Grand Forks 28 April 1997
“The inability to get realistic flood numbers certainly hindered the communities' ability to prepare” U.S. Representative Earl Pomery (D-ND) 4 May 1997
Placing the 1997 outlook into historical context, indicates that the 1997 prediction was worse than average in terms of feet, but perhaps more importantly, better than average in terms of percentage.
Understandings of the Flood Predictions • Early outlook: 47.5 feet and 49 feet • Interpretation of the outlook • Range • Not-to-be-exceeded • Exact • Uncertain (by how much?)
"[NWS] experts are still forecasting a maximum 49-foot crest for the Red at East Grand Forks” The Grand Forks Herald 8 April 1997
Other explanations: • “The NWS Blew It” • “An $800 Million Dollar Miscommunication”
The Linear Model of Prediction Predict Communicate Decide • Product focused • Pipeline metaphor
An Alternative • Process focused • Decision Focused • Symphony metaphor • Hooke and Pielke (2000)
We must move beyond the linear -- “end-to-end” -- conception of the relationship of prediction with decision. • Think symphony orchestra not assembly line!!!