Download
1 / 6
60 likes | 351 Vues
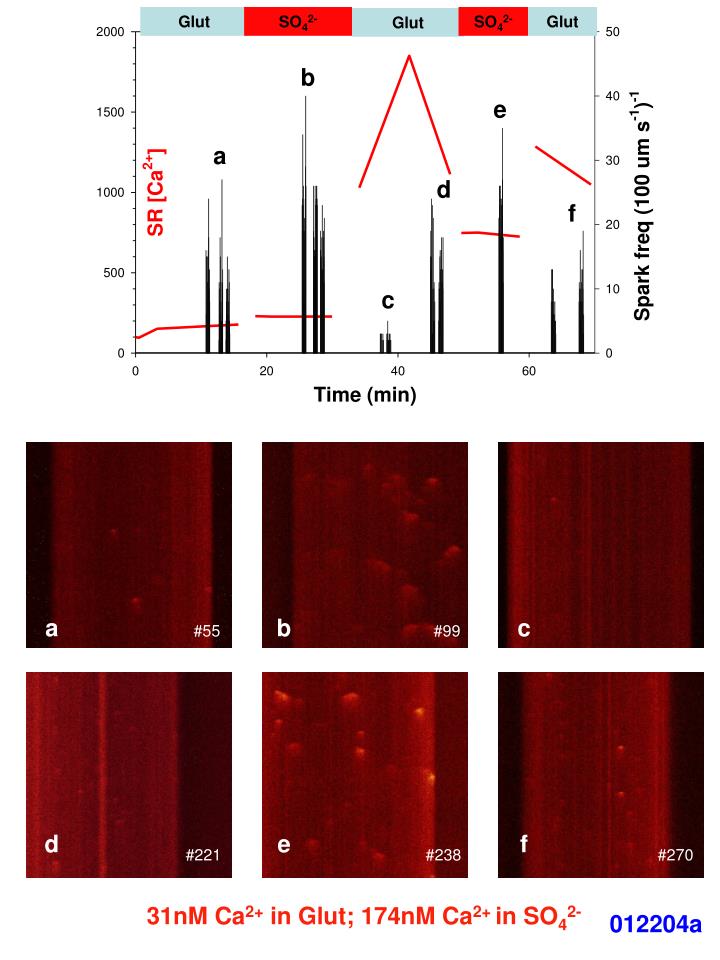
a. b. c. #55. #99. d. e. f. #221. #238. Glut. SO 4 2-. SO 4 2-. Glut. Glut. b. e. a. d. f. c. #162. #270. 31nM Ca 2+ in Glut; 174nM Ca 2+ in SO 4 2-. 012204a. 012204a. SO 4 2-. EGTA. 110904d. 50 μ M TBQ. SO 4 2- , 100 nM Ca 2+ , 0.4 mM Mg 2+.

E N D
a b c #55 #99 d e f #221 #238 Glut SO42- SO42- Glut Glut b e a d f c #162 #270 31nM Ca2+ in Glut; 174nM Ca2+ in SO42- 012204a
SO42- EGTA 110904d 50 μM TBQ SO42-, 100 nM Ca2+, 0.4 mM Mg2+ 50 mM EGTA, 1 mM Mg2+ 111804b
Glut SO42- Glut 033004a
A 0 s 2 min 5 s 3 min 5 s 4 min 30 s 11 min 30 s B 15 min 22 s 17 min 22 s 22 min 22 s 12 min 53 s 13 min 56 s C 23 min 53 s 24 min 54 s 26 min 23 s 28 min 23 s D Glut Glut 50 Pi Cell region Whole SR [Ca2+] (μM) Edge Middle Fig x: The effect of inorganic phosphate on SR [Ca2+]. Organelle-trapped mag-indo showing the change in SR [Ca2+] in the presence of cytoplasmic solutions containing K-glutamate, 1 mM EGTA (200 nM Ca2+) and 0.4 mM Mg2+ (A), 50 mM Pi, 1 mM EGTA (200 nM Ca2+) and 1 mM Mg2+(B) and then upon return to K-glutamate (C). The time passed since the start of the experiment is noted on each panel. The image at time 0 was in the presence of 0 Ca, 0 ATP (“relaxing”) solution. The SR [Ca2+] changes are summarized in D. Note that there were significant spatial SR [Ca2+] gradients between the edge and middle of the cell in C (indicated by the blue and green bars, respectively), which are plotted in D. The whole cell SR [Ca2+] average is plotted in red in D. Fiber identifier: 011604a.