Download
1 / 14
140 likes | 308 Vues
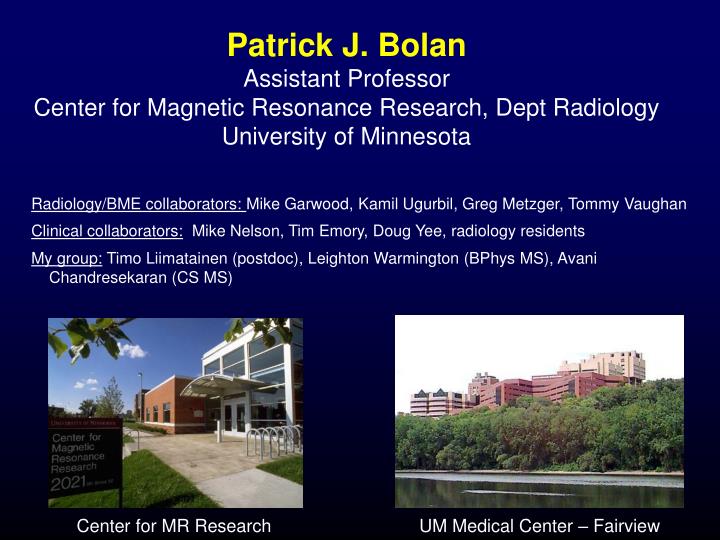
Patrick J. Bolan Assistant Professor Center for Magnetic Resonance Research, Dept Radiology University of Minnesota. Radiology/BME collaborators: Mike Garwood, Kamil Ugurbil , Greg Metzger, Tommy Vaughan Clinical collaborators: Mike Nelson, Tim Emory, Doug Yee, radiology residents

E N D
Patrick J. Bolan Assistant Professor Center for Magnetic Resonance Research, Dept Radiology University of Minnesota Radiology/BME collaborators: Mike Garwood, KamilUgurbil, Greg Metzger, Tommy Vaughan Clinical collaborators: Mike Nelson, Tim Emory, Doug Yee, radiology residents My group:TimoLiimatainen (postdoc), Leighton Warmington (BPhys MS), AvaniChandresekaran (CS MS) Center for MR Research UM Medical Center – Fairview
Areas of Research • Breast MR imaging and spectroscopy • Evaluating cancer treatment response • High-field Body MR Technique 3T 4T 7T
Breast MR Spectroscopy Single-Voxel 1H MRS Contrast-enhanced MRI suppressed water lipids Choline compounds (tCho) lipid invasive ductal carcinoma Frequency (ppm) High [tCho] cancer (proliferation, cell density, upgragulated transport & kinase activity)
Diagnosing Suspicious Lesions at 4T 10 ROC cutoff = 1.0 mmol/kg sensitivity 72% specificity 83% 8 6 [tCho] (mmol/kg) 4 2 0 Malignant (n=58) Benign (n=54) Normal (n=5) Haddadin et al., NMR Biomed 2009
Treatment Monitoring with MRS • Size changes takes weeks, metabolic take hours • [tCho] as a Predictive Biomarker • switch drugs / treatment strategy • evaluate new drugs / therapies with short exposure • More robust than diagnostic setting • Lesions are bigger more SNR • Longitudinal data self normalizing
Objective Responder A 6 5 4 3 2 1 0 6 5 4 3 2 1 0 6 5 4 3 2 1 0 ppm Baseline LD0 = 2.7 cm Vol0 = 20 cc [tCho]0 = 8.4 mmol/kg B AC X 1 LD24 = 2.7 cm Vol24 = 20 cc [tCho]24 = 7.4 mmol/kg C AC X 4 LDf = 1.5 cm Volf = 2 cc [tCho]f = 0 mmol/kg %ΔtCho24 = -12%, %ΔLD = -44%, %ΔVol = -90% Meisamy et al., Radiology 2004
9 9 8 8 7 7 6 6 5 5 [tCho] (mmol/kg) [tCho] (mmol/kg) 4 4 3 3 2 2 1 1 0 0 Baseline Day 1 Baseline Day 1 Objective Responders (N=17/21) Nonresponders(N=13/15) Day-1 ∆[tCho] predicts response: accuracy 83% PPV 90% NPV 77% Haddadin et al., NMR Biomed 2009
I-SPY / ACRIN 6657: Multi-site breast MRS trial A/C Taxane Surgery • Nola Hylton & Laura Esserman, UCSF • Monitoring neoadjuvant chemo with DCE-MRI + MRS • Single voxel MRS, water as internal reference (T2-corrected) • Stratified by field strength (1.5T/3T) & MR2 timing (1 day / 2-4 days) • 7 sites accruing, 33% done (March 2009) MRI/MRS #2 MRI/MRS #3 pre-op MRI/MRS #1 + 4 cores UC 1.5T Philips 3T Philips UMN 1.5T Siemens MSKCC 1.5T GE UW 1.5T GE 3T Philips UPenn 3T Siemens UCSF 1.5T GE Georgetown 1.5T Siemens UTSW 1.5T Philips 3T Philips Mayo 1.5T GE
ACRIN 6657 MRS Analysis Feedback for training/technical QC subcontracted ACRIN CORE Lab QC Phantom analysis
Open Breast MRS Trials • Pfizer Phase I, CP-751,871 (Yee) • anti IGF-1R • 4T CMRR • Novartis Phase II, RAD001/Everolimus (Yee) • mTOR inhibitor • 4T CMRR • Komen, RFA Ablation (Tuttle) • Dual contrast MRI pre- and post-RFA • 4T CMRR • I-SPY/ACRIN 6657 (Peterson/Nelson) • AC/Tax • Fairview 1.5T / 3T
x y z Methods for High-Field MR: acquisition Novel Acquisition Strategies Pulse sequences water sidebands sidebands 57 TE (ms) 45 -100 -300 100 300 -500 -500 Hz Novel Hardware Spectroscopic imaging Single-voxel
Methods for High-Field MR: analysis data model baseline residual Spectral Fitting Quantification Post-processing, artifact correction
Methods for High-Field MR: imaging B) Simulated Bolus Gd Concentrations A) GRE signal strength 7 No T2* effect AIF 1.5T blood 6 cancer 0.25 3T blood normal PZ 7T blood Novel Sequences 1.5T tissue 5 0.2 3T tissue 7T tissue 4 Parallel Imaging Signal intensity (a.u.) [Gd] (mM) 0.15 3 0.1 2 0.05 1 0 0 0 1 2 3 4 5 6 7 8 0 50 100 150 200 250 300 [Gd] (mM) time (s) C) Arterial Signal Intensity D) Tissue Signal Intensity 0.2 0.08 Cancer, ignoring T2* Simulation, Optimization 0.18 Ignoring T2* 0.07 Cancer, w/tissue T2* T2* blood @ 7T Normal PZ, ignoring T2* 0.16 Normal PZ, w/tissue T2* 0.06 0.14 0.05 0.12 Signal intensity (a.u.) Signal intensity (a.u.) 0.1 0.04 0.08 0.03 0.06 0.02 0.04 0.01 0.02 0 0 0 50 100 150 200 250 300 0 50 100 150 200 250 300 time (s) time (s) Figure 11 – Simulations showing that R2* effects of Gd-based contrast agents increase at ultra-high field, and substantially impact both blood and tissue signal intensity. See text for details.
7T Body MR from CMRR Prostate Cardiac Axial Whole-body PCr PCho Pi ATP MSK Liver