Download
1 / 17
170 likes | 329 Vues
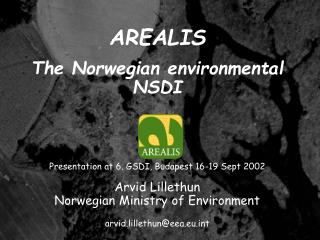
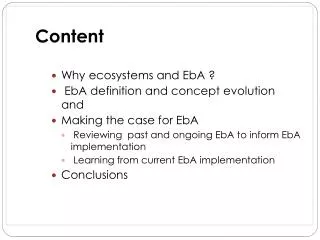
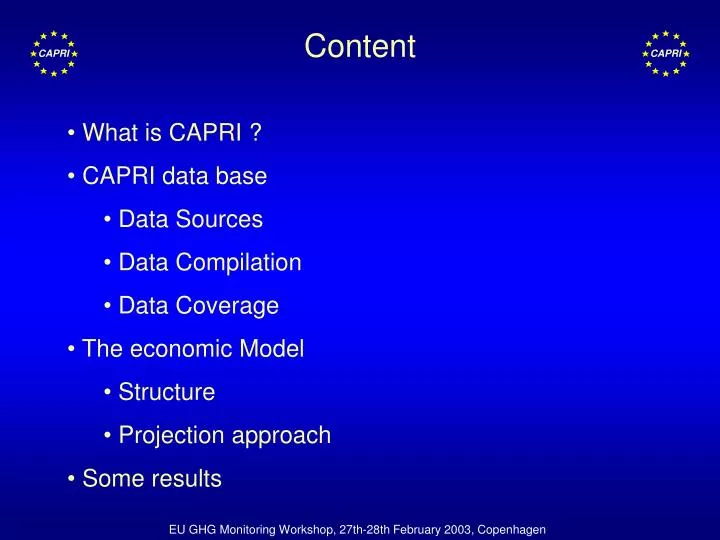
Content. What is CAPRI ? CAPRI data base Data Sources Data Compilation Data Coverage The economic Model Structure Projection approach Some results. What is CAPRI ?. C ommon A gricultural P olicy R egionalised I mpact analysis on regionalised level (NUTS II)

E N D
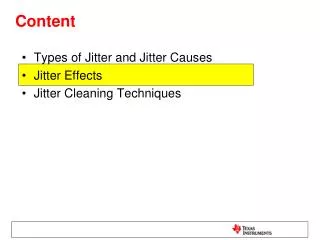
Content • What is CAPRI ? • CAPRI data base • Data Sources • Data Compilation • Data Coverage • The economic Model • Structure • Projection approach • Some results
What is CAPRI ? • Common Agricultural Policy Regionalised Impact analysis • on regionalised level (NUTS II) • on whole agricultural sector: all outputs/inputs covered • based on a quantitative economic modelling system • developed and maintained by an independent network of research institutions • mainly funded by DG-RSRCH framework programs
CAPRI Modelling system • Modelling system consists of • Regionalised data base • Supply Module • Market Module • Exploitation and Reporting tools
CAPRI data base • Combines consistently time series • at EU/national/regional/farm type level • on herds/acreages, production, market balances • on prices, economic accounts • on input & output coefficients • on policy instruments
Data sources • As far as possible uniform sources • EUROSTAT: market balances, slaughtering statistics, land use statistics, herd countings • Farm Accounting Data Network: Production program for farm type module, Estimation of input demand functions • Gaps closed by regional and national statistics • Input/Output relations, emission coefficients etc. from different sources
Data compilation • Own “base model” ensures consistent and closed data base • Gaps are closed and inconsistencies removed • by simultaneous estimation techniques • under constraints capturing consistency requirements
Data coverage for Herd Sizes I • Animal herds for • dairy cows, other cows • cattle raising (male & female calves, raising heifers) • sows • milk sheep & goat • laying hens • yearly averages over all available countings
Data coverage for Herd Sizes II • Slaughtered heads for • calves fattening (male/female) • male adult fattening (male/female) • pig fattening • sheep & goat fattening • poultry fattening • estimates regarding the length of production cycle allow calculation of herd sizes
Consistency requirements • Intertemporal flow model for herds: Slaughtered + herd size changes + exported animals = raised/born animals in t(-1) + imported animals • Slaughter weight * slaughtered heads = production • Market balances for meats, milk, eggs • Fat and protein balances for milk and milk products • Plausible number of siblings (cows, sows, mother sheep&goat) • Male/Female relationship for calves • Plausible slaughter weights and output coefficients
Milk Cows SucklerCows BreedingHeifers Youngcow Beef RaisingfemaleCalves FatteningfemaleCalves FatteningHeifers High/Low FemaleCalf Youngheifer RaisingmaleCalves Youngbull MaleCalf FatteningmaleCalves Male adultcattle High/Low Beef Veal Herd flow model for cattle
Nitrogenfrom animals Grazing NH3 stable NH3 storage NH3 NH3 Mineral N NH3 CropN Need Organic Napplication Ammonia Emissions
Modelling system AggregatedSupply &Feed demand ExploitationEnv. IndicatorsWelfare analysis FEOGA budget Market ModuleSpatialMulti-Commodity Model11 regional aggregatesplus all EU MS States Supply Module200 Regional or1050 Farm Type Programming Models Perennial Sub-Module Premiums Prices Policy ModulesCAP Premiums(base areas, ...) Young Animal Market ModuleLinked MSProgramming Models HerdsAcreages Aggregation
Projections • “Baseline”: • developments of agricultural markets, prices,yields, input demand, cropping patterns, herd sizes ...under continuation of current policy setting • model mechanism + trend analysis+ judgement + careful look at other projections • model ensures closed balances for inputs and outputs (including nutrients, feed and young animals) • and matching price developments
Reporting • Java based Mapping tool • HTML reporting tools (XML + XSL) • Tables in DBMS
Stocking density with cattle heads/ha UAAR, average 1994
Methane emissions from animals In kg/ha UAA, average 1998
Methane emissions from animals Kg/ha UAAPercentage change, 2009/1998