Download
1 / 68
680 likes | 856 Vues
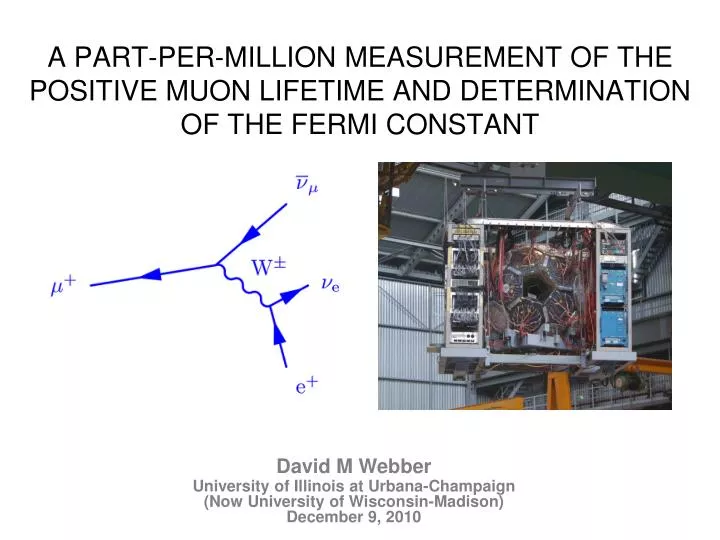
A PART-PER-MILLION MEASUREMENT OF THE POSITIVE MUON LIFETIME AND DETERMINATION OF THE FERMI CONSTANT. David M Webber University of Illinois at Urbana-Champaign (Now University of Wisconsin-Madison) December 9, 2010. Outline. Motivation Experiment Hardware Analysis Pulse Fitting

E N D
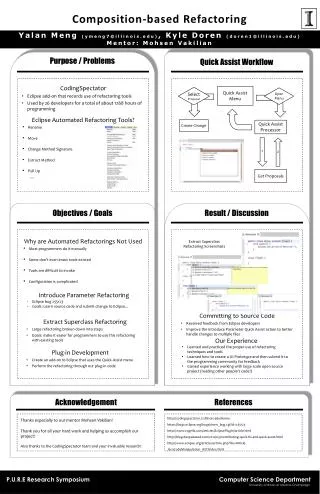
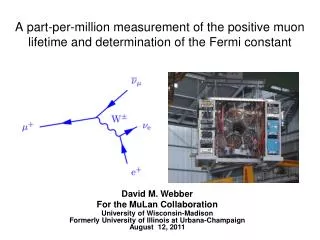
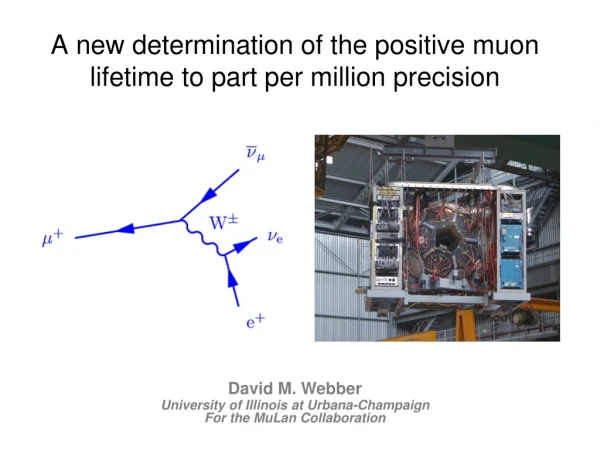
A PART-PER-MILLION MEASUREMENT OF THE POSITIVE MUON LIFETIME AND DETERMINATION OF THE FERMI CONSTANT David M Webber University of Illinois at Urbana-Champaign (Now University of Wisconsin-Madison) December 9, 2010
Outline • Motivation • Experiment Hardware • Analysis • Pulse Fitting • Fit Results • Systematic Uncertainties • Gain Stability • Pileup • Spin Rotation • Final Results D. M. Webber
Motivation • gives the Fermi Constant to unprecedented precision (actually Gm) • needed for “reference” lifetime for precision muon capture experiments • MuCap • MuSun Capture rate from lifetime difference m-and m+
The predictive power of the Standard Model depends on well-measured input parameters What are the fundamental electroweak parameters (need 3)? a GF MZ sin2qw MW 0.00068 ppm 8.6 ppm 23 ppm 650 ppm 360 ppm * circa 2000 Obtained from muon lifetime Other input parameters include fermion masses, and mixing matrix elements: CKM – quark mixing PMNS – neutrino mixing
Contains all weak interaction loop corrections Dq The Fermi constant is related to the electroweak gauge coupling g by In the Fermi theory, muon decay is a contact interaction where Dq includes phase space, QED, hadronic and radiative corrections In 1999, van Ritbergen and Stuart completed full 2-loop QED corrections reducing the uncertainty in GF from theory to < 0.3 ppm (it was the dominant error before) D. M. Webber
The push – pull of experiment and theory • Lifetime now largest uncertainty leads to 2 new experiments launched: MuLan & FAST • Both @ PSI, but very different techniques • Both aim at “ppm” level GF determinations • Both published intermediate results on small data samples • Meanwhile, more theory updates !!
The lifetime difference between tm+ and tm- in hydrogen leads to the singlet capture rate LS 1.0 ppm MuLan ~10 ppm MuCap log(counts) MuCap nearly complete μ+ μ – time The singlet capture rate is used to determine gPand compare with theory gP
Experiment D. M. Webber
For 1ppm, need more than 1 trillion (1012) muons ... πE3 Beamline, Paul Scherrer Institut, Villigen, Switzerland
Momentum Selection The beamline transports ~107“surface” muons per second to the experimental area. Parallel beam Spatial focus Velocity separator removes beam positrons
A kicker is used to create the time structure. 5 ms 22 ms counts arb. Extinction ~ 1000 Trigger Suppression Accumulation Period Measuring Period kicker
ARNOKROME™ III (AK-3) high-field target used in 2006- Rapid precession of muon spin - mSR studies show fast damping
Target rotates out of beam The target was opened once per day to view the beam profile. D. M. Webber
In 2006, The ferromagnetic target dephases the muons during accumulation. • Arnokrome-3 (AK3) Target (~28% chromium, ~8% cobalt, ~64% iron) • 0.5 T internal magnetic field • Muons arrive randomly during 5 ms accumulation period • Muons precess by 0 to 350 revolutions D. M. Webber
2007 target: crystal quartz, surrounded by an external ~ 135 G magnetic field Installed Halbach Array • 90% muonium formation • “Test” of lifetime in muonium vs. free • Rapid spin precession not observable by us • 10% “free” muons • Precession noticeable and small longitudinal polarization exists • Creates analysis challenges ! • Magnet ring “shadows” part of detector Quartz
450 MHz WaveForm Digitization (2006/07) MHTDC (2004) The experimental concept… 170 Inner/Outer tile pairs Real data Kicker On Measurement Period Number (log scale) time Fill Period -12.5 kV 12.5 kV
The detector is composed of 20 hexagonand 10 pentagon sections, forming a truncated icosahedron. Each section contains either 6 or 5tile elements a Each element is made from two independentscintillator tiles with light guides and photomultiplier tubes.
Waveform Digitizers 2 Analog Pulses 1/6 of system 170 scintillator tile pairs readout using 450 MHz waveform digitizers. x2 1 clock tick = 2.2 ns Uncertainty on lifetime from gain stability: 0.25 ppm D. M. Webber
Checked for consistency throughout the run. Compared to Quartzlock A10-R rubidium frequency standard. Compared to calibrated frequency counter Different blinded frequencies in 2006 and 2007 The clock was provided by an Agilent E4400B Signal Generator, which was stable during the run and found to be accurate to 0.025 ppm. Agilent E4400 Function Generator f = 450.87649126MHz f = 451.0 +/- 0.2 Average difference = 0.025 ppm
MuLan collected two datasets, each containing 1012 muon decays Two (very different) data sets Different blinded clock frequencies used Revealed only after all analyses of both data sets completed Most systematic errors are common Datasets agree to sub-ppm Ferromagnetic Target, 2006 Quartz Target, 2007
Analysis D. M. Webber
Raw waveforms are fit with templates to find pulse amplitudes and times >2 x 10¹²pulses in 2006 data set >65 TBytes raw data inner A difficult fit Normal Pulse ADT Template outer Two pulses close together D. M. Webber
Nearby pulses perturb the time of main pulses.Studied with simulations Fixed reference Dtavg perturbation Dtavg Estimated pull: D. M. Webber
ppm tm + Dsecret 22 ms Rvs fit start time Red band is the set-subset allowed variance 2006: Fit of 30,000 AK-3 pileup-corrected runs. Relative t (ppm) 0 9 ms
2007: Quartz data fits well as a simple sum, exploiting the symmetry of the detector. The mSR remnants vanish.
Systematics Introduction D. M. Webber
Challenging Leading systematic considerations:
Systematics:Gain Stability D. M. Webber
Gain is photomultiplier tube type dependent Artifact from start signal Deviation at t=0 1 ADC = 0.004 V Sag in tube response 0 10 20 ms D. M. Webber
Gain variation vs. time is derived from the stability of the peak (MPV) of the fit to pulse distribution If MPV moves, implies greater or fewer hits will be over threshold 0 10 20 ms Carefully studied over the summer. Gain correction is 0.5 ppm shift with 0.25 ppm uncertainty. 33
Systematics:Pileup D. M. Webber
Measured t vs. Deadtime Normal Time Distribution RawSpectrum Pileup Corrected Pileup Time Distribution Leading order pileup to a ~5x10⁻⁴ effect • Statistically reconstruct • pileup time distribution • Fit corrected distribution Fill i Fill i+1 1/t– 2/t 2/t
Introducing higher-order pileup A B C D E F G triple hit hit pileup Inner tile Artificial deadtime Artificial deadtime Artificial deadtime time time Outer tile Artificial deadtime D. M. Webber
R (ppm) 1 ppm 150 ns deadtime range Artificial Deadtime (ct) Pileup to sub-ppm requires higher-order terms • 12 ns deadtime, pileup has a 5 x 10⁻⁴ probability at our rates • Left uncorrected, lifetime wrong by 100’s of ppm • Proof of procedure validated with detailed Monte Carlo simulation uncorrected Pileup terms at different orders …
The pileup corrections were tested with Monte-Carlo. Monte-Carlo Simulation, 1012 events agrees with truth to < 0.2 ppm 1.19 ppm statistical uncertainty D. M. Webber
Lifetime vs. artificially imposed deadtime window is an important diagnostic A slope exists due to a pileup undercorrection 1 ppm 150 ns deadtime range Extrapolation to 0 deadtime is correct answer D. M. Webber 39 Pileup Correction Uncertainty: 0.2 ppm
Explanations of R vs. ADT slope • Gain stability vs. Dt? • No. Included in gain stability systematic uncertainty. • Missed correction? • Possibly • Extrapolation to ADT=0 valid • Beam fluctuations? • Likely • Fluctuations at 4% level in ion source exist • Extrapolation to ADT=0 valid D. M. Webber
Systematics Spin Precession D. M. Webber
The decay positron energy and angular distributions are not uniform, resulting in position dependant measurement rates. Highest Energy Positrons Lowest Energy Positrons q e+ Ee = Emax = 52.83 MeV Positron energy distribution • Lowest energy positron when neutrinos are anti-parallel. • Neutrino helicities add so that they have angular momentum of 2. • Positron spin must compensate to bring total to 1. • Chiral suppression (not well justified at this energy) makes positron most likely right handed. • Most probable positron direction is opposite muon spin • Highest energy positron when neutrinos are parallel. • Neutrino helicities cancel angular momentum. • Positron spin must be in the same direction as muon spin. • Chiral limit dictates right handed positrons. • Most probable positron direction is same as muon spin Ee = 26.4 MeV Ee = 13.2 MeV Detectionthreshold
mSR rotation results in an oscillation of the measurement probability for a given detector. B B = 34 G B = 1 G counts arb. counts arb. This oscillation is not easily detectedand systematic errors may arise This oscillation is easily detected
The sum cancels muSR effects; the difference accentuates the effect. counts arb. B counts arb. Sum Difference/Sum counts arb.
2006 target: AK3 ferromagnetic alloy with high internal magnetic field • Arnokrome-3 (AK3) Target (~28% chromium, ~8% cobalt, ~64% iron) • 0.4 T transverse field rotates muons with 18 ns period • Muons arrive randomly during 5 ms accumulation period • Muons precess by 0 to 350 revolutions DEPHASED small ensemble avg. polarization Ensemble Averge Polarization
All 170 Detectors 85 Opposite Pairs Lifetime Opposite pairs summed Front Back “front-back folded” A small asymmetry exists front / back owing to residual longitudinal polarization When front / back opposite tile pairs are added first, there is no distortion
2007 target: crystal quartz, surrounded by an external ~ 135 G magnetic field Installed Halbach Array • 90% muonium formation • “Test” of lifetime in muonium vs. free • Rapid spin precession not observable by us • 10% “free” muons • Precession noticeable and small longitudinal polarization exists • Creates analysis challenges ! • Magnet ring “shadows” part of detector Quartz
Difference between Top of Ball and Bottom of Ball to Sum, vs time-in-fill We directly confront the mSR. Fit each detector for an “effective lifetime.” Would be correct, except for remnant longitudinal polarization relaxation. Illustration of free muon precession in top/bottom detector differences
Longitudinal polarization distorts result in predictable manner depending on location. The ensemble of lifetimes is fit to obtain the actual lifetime. (Method robust in MC studies) Relative effective lifetime (ppm) (+ blind offset) Magnet-right data
2007: Consistency against MANY special runs, where we varied target, magnet, ball position, etc. Start-time scan
Consistency Checks D. M. Webber
ppm tm + Dsecret 22 ms Rvs fit start time Red band is the set-subset allowed variance 2006: Fit of 30,000 AK-3 pileup-corrected runs Relative t (ppm) 0 9 ms
All 170 Detectors 85 Opposite Pairs 2006: AK-3 target consistent fits of individual detectors, but opposite pairs – summed – is better Difference of Individual lifetimes to average