Download
1 / 18
190 likes | 375 Vues
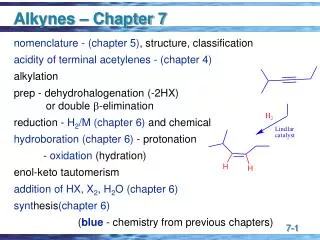
Chapter Eight & Chapter Nine. 8 Measurement and Scaling: Fundamentals and Comparative Scaling 9 Measurement and Scaling: Noncomparative Scaling Techniques. Measurement and Scaling.

E N D
Chapter Eight & Chapter Nine 8 Measurement and Scaling: Fundamentals and Comparative Scaling 9 Measurement and Scaling: Noncomparative ScalingTechniques
Measurement and Scaling Measurement means assigning numbers or other symbols to characteristics of objects according to certain prespecified rules. • One-to-one correspondence between the numbers and the characteristics being measured. • The rules for assigning numbers should be standardized and applied uniformly. • Rules must not change over objects or time.
Third place Second place First place Primary Scales of Measurement Figure 8.1 Scale NominalNumbers Assigned to Runners OrdinalRank Order of Winners IntervalPerformance Rating on a 0 to 10 Scale Ratio Time to Finish, in Seconds Finish 7 8 3 Finish 8.2 9.1 9.6 15.2 14.1 13.4
Primary Scales of Measurement Table 8.1
Scale Evaluation Reliability Validity Generalizability Test/ Retest Alternative Forms Internal Consistency Content Criterion Construct Convergent Discriminant Nomological Scale Evaluation Figure 9.5
Measurement Accuracy The true score model provides a framework for understanding the accuracy of measurement. XO = XT + XS + XR where XO = the observed score or measurement XT = the true score of the characteristic XS = systematic error XR = random error
Potential Sources of Error on Measurement Figure 9.6 1) Other relatively stable characteristics of the individual that influence the test score, such as intelligence, social desirability, and education. 2) Short-term or transient personal factors, such as health, emotions,and fatigue. 3) Situational factors, such as the presence of other people, noise, and distractions. 4) Sampling of items included in the scale: addition, deletion, or changes in the scale items. 5) Lack of clarity of the scale, including the instructions or the items themselves. 6) Mechanical factors, such as poor printing, overcrowding items in the questionnaire, and poor design. 7) Administration of the scale, such as differences among interviewers. 8) Analysis factors, such as differences in scoring and statistical analysis.
Reliability • Reliability can be defined as the extent to which measures are free from random error, XR. If XR = 0, the measure is perfectly reliable. • In test-retest reliability, respondents are administered identical sets of scale items at two different times and the degree of similarity between the two measurements is determined. • In alternative-forms reliability, two equivalent forms of the scale are constructed and the same respondents are measured at two different times, with a different form being used each time.
Reliability • Internal consistency reliability determines the extent to which different parts of a summated scale are consistent in what they indicate about the characteristic being measured. • In split-half reliability, the items on the scale are divided into two halves and the resulting half scores are correlated. • The coefficient alpha, or Cronbach's alpha, is the average of all possible split-half coefficients resulting from different ways of splitting the scale items. This coefficient varies from 0 to 1, and a value of 0.6 or less generally indicates unsatisfactory internal consistency reliability.
Validity • The validity of a scale may be defined as the extent to which differences in observed scale scores reflect true differences among objects on the characteristic being measured, rather than systematic or random error. Perfect validity requires that there be no measurement error (XO = XT, XR = 0, XS = 0). • Content validity is a subjective but systematic evaluation of how well the content of a scale represents the measurement task at hand. • Criterion validity reflects whether a scale performs as expected in relation to other variables selected (criterion variables) as meaningful criteria.
Validity • Construct validity addresses the question of what construct or characteristic the scale is, in fact, measuring. Construct validity includes convergent, discriminant, and nomological validity. • Convergent validity is the extent to which the scale correlates positively with other measures of the same construct. • Discriminant validity is the extent to which a measure does not correlate with other constructs from which it is supposed to differ. • Nomological validity is the extent to which the scale correlates in theoretically predicted ways with measures of different but related constructs.
Relationship Between Reliability and Validity • If a measure is perfectly valid, it is also perfectly reliable. In this case XO = XT, XR = 0, and XS = 0. • If a measure is unreliable, it cannot be perfectly valid, since at a minimum XO = XT + XR. Furthermore, systematic error may also be present, i.e., XS≠0. Thus, unreliability implies invalidity. • If a measure is perfectly reliable, it may or may not be perfectly valid, because systematic error may still be present (XO = XT + XS). • Reliability is a necessary, but not sufficient, condition for validity.
Development of a Multi-item Scale Figure 9.4 Develop Theory Generate Initial Pool of Items: Theory, Secondary Data, and Qualitative Research Select a Reduced Set of Items Based on Qualitative Judgement Collect Data from a Large Pretest Sample Statistical Analysis Develop Purified Scale Collect More Data from a Different Sample Evaluate Scale Reliability, Validity, and Generalizability Final Scale
Scaling Techniques Noncomparative Scales Comparative Scales Continuous Rating Scales Itemized Rating Scales Paired Comparison Rank Order Constant Sum Q-Sort and Other Procedures Semantic Differential Stapel Likert A Classification of Scaling Techniques Figure 8.2
Summary of Itemized Scale Decisions Table 9.2 1) Number of categories Although there is no single, optimal number, traditional guidelines suggest that there should be between five and nine categories 2) Balanced vs. unbalanced In general, the scale should be balanced to obtain objective data 3) Odd/even no. of categories If a neutral or indifferent scale response is possible from at least some of the respondents, an odd number of categories should be used 4) Forced vs. non-forced In situations where the respondents are expected to have no opinion, the accuracy of the data may be improved by a non-forced scale 5) Verbal description An argument can be made for labeling all or many scale categories. The category descriptions should be located as close to the response categories as possible 6)Physical form A number of options should be tried and the best selected
Balanced and Unbalanced Scales Figure 9.1 Jovan Musk for Men is Jovan Musk for Men isExtremely good Extremely good Very good Very good GoodGood Bad Somewhat good Very bad Bad Extremely badVery bad Balanced Scale Unbalanced Scale
Rating Scale Configurations A variety of scale configurations may be employed to measure the gentleness of Cheer detergent. Some examples include: Cheer detergent is: 1) Very harsh --- --- --- --- --- --- --- Very gentle 2) Very harsh 1 2 3 4 5 6 7 Very gentle 3) . Very harsh . . . Neither harsh nor gentle . . . Very gentle 4) ____ ____ ____ ____ ____ ____ ____ Very Harsh Somewhat Neither harsh Somewhat Gentle Very harsh Harsh nor gentle gentle gentle 5) Very Neither harsh Very harsh nor gentle gentle Figure 9.2 Cheer -3 -2 -1 0 +1 +2 +3
Some Unique Rating Scale Configurations Thermometer Scale Instructions: Please indicate how much you like McDonald’s hamburgers by coloring in the thermometer. Start at the bottom and color up to the temperature level that best indicates how strong your preference is. Form: Smiling Face Scale Instructions: Please point to the face that shows how much you like the Barbie Doll. If you do not like the Barbie Doll at all, you would point to Face 1. If you liked it very much, you would point to Face 5. Form: 1 2 3 4 5 Figure 9.3 Like very much 100 75 50 25 0 Dislike very much