Download
1 / 30
310 likes | 551 Vues
ECE 530 – Analysis Techniques for Large-Scale Electrical Systems. Lecture 1: Power System Overview. Prof. Hao Zhu Dept. of Electrical and Computer Engineering University of Illinois at Urbana-Champaign haozhu@illinois.edu Acknowledgement: Prof. Overbye (taught ECE 530 in Fall’13).

E N D
ECE 530 – Analysis Techniques for Large-Scale Electrical Systems Lecture 1: Power System Overview Prof. Hao Zhu Dept. of Electrical and Computer Engineering University of Illinois at Urbana-Champaign haozhu@illinois.edu Acknowledgement: Prof. Overbye (taught ECE 530 in Fall’13)
Course Overview • Course presents the fundamental analytic, simulation and computation techniques for the analysis of large-scale electrical systems. • The course stresses the importance of the structural characteristics of the systems, with an aim towards practical analysis.
Course Syllabus • Course mechanics and topics • Introduction • Analysis of nonlinear electrical systems, with detailed coverage of power flow and related issues • Data and computational issues associated with large-scale systems including sparsity and visualization • Nonlinear parameter estimation in electrical systems • Modeling for dynamic analysis including time scale separation and modal analysis • Dynamic performance analysis including solution of differential-algebraic systems
References • Sources of Info: Books, journals, conferences, and real-life problems • A. J. Wood, B. F. Wollenberg, and G. B. Sheble, “Power Generation, Operation, & Control,” 3rd ed., 2014 • A. R. Bergen, “Power Systems Analysis,” 1986 • M. Crow, “Computational Methods for Electric Power Systems,” 2002. • Y. Saad, “Iterative Methods for Sparse Linear Systems,” 1996. (Free online)
Other resources • IEEEXplore, Google scholar • Peers, networking http://matt.might.net/articles/phd-school-in-pictures/
Simple Power System • Every power system has three major components • generation: source of power, ideally with a specified voltage and frequency • load: consumes power; ideally with a constant resistive value • transmission system: transmits power; ideally as a perfect conductor
Complications • No ideal voltage sources exist • Loads are seldom constant • Transmission system has resistance, inductance, capacitance and flow limitations • Simple system has no redundancy so power system will not work if any component fails
Notation - Power • Power: Instantaneous consumption of energy • Power Units Watts = voltage x current for dc (W) kW – 1 x 10³ Watt MW – 1 x 10⁶ Watt GW – 1 x 10⁹ Watt TW – 1 x 10¹² Watt • Installed U.S. generation capacity is about 900 GW ( about 3 kW per person) • Maximum load of Champaign/Urbana about 300 MW
Notation - Energy • Energy: Integration of power over time; energy is what people really want from a power system • Energy Units Joule = 1 Watt-second (J) kWh – Kilowatthour (3.6 x 10⁶ J) MWh – One MW for one hour TWh – One million MWh Btu – 1055 J; 1 MBtu=0.292 MWh • U.S. electric energy consumption is about 4000 TWh kWh (about 12,500 kWh per person, which means on average we each use 1.4 kW of power continuously)
Notation and Voltages • The IEEE standard is to write ac and dc in smaller case, but it is often written in upper case as AC and DC. • Three-phase is usually written with the dash, also as 3-phase. • In the US the standard household voltage is 120/240, +/- 5%. Edison actually started at 110V dc. Other countries have other standards, with the European Union recently standardizing at 230V. Japan’s voltage is just 100V.
Power System Examples • Electric utility: can range from quite small, such as an island, to one covering half the continent • there are four major interconnected ac power systems in North American, each operating at 60 Hz ac; 50 Hz is used in some other countries. • Airplanes and Spaceships: reduction in weight is primary consideration; frequency is 400 Hz. • Ships and submarines • Automobiles: dc with 12 volts standard • Battery operated portable systems
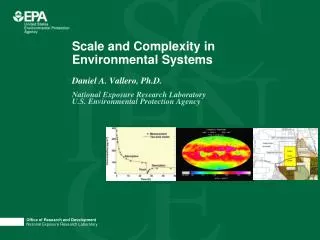
Electric Systems in Energy Context • Class focuses on electric power systems, but we first need to put the electric system in context of the total energy delivery system • Electricity is used primarily as a means for energy transportation • Use other sources of energy to create it, and it is usually converted into another form of energy when used • About 40% of US energy is transported in electric form • Concerns about need to reduce CO2 emissions and fossil fuel depletion are becoming main drivers for change in world energy infrastructure
Sources of Energy - US About 40% of our energy is consumed in the formof electricity, a percentagethat is gradually increasing.The vast majority of the non-fossil fuel energy is electric! In 2012 we got about 1.4% of our energy from wind and 0.04% from solar (PV andsolar thermal) About 84% Fossil Fuels 1 Quad = 293 billion kWh (actual), 1 Quad = 98 billion kWh (used, taking into account efficiency) Source: EIA Annual Energy Outlook 2013, Electric Power Monthly, July 2013
US Historical and Projected Energy Usage Projections say we will still be 79% fossil in 2040! Source: EIA Annual Energy Outlook 2014
Worldwide Energy Usage Source: EIA International Energy Outlook, 2013
1980-2011 Energy by Region million toe Latin America North America Former Soviet Union Asia Middle East Europe Africa
Electric Energy Economics • Electric generating technologies involve a tradeoff between fixed costs (costs to build them) and operating costs • Nuclear and solar high fixed costs, but low operating costs • Natural gas/oil have low fixed costs but high operating costs (dependent upon fuel prices) • Coal, wind, hydro are in between • Also the units capacity factor is important to determining ultimate cost of electricity • Potential carbon “tax” seen as unlikely soon
Ball park Energy Costs Nuclear: $15/MWh Coal: $22/MWh Wind: $50/MWh Hydro: varies but usually water constrained Solar: $120 to 180/MWh Natural Gas: 8 to 10 times fuel cost in $/Mbtu (3-12) Note, to get price in cents/kWh take price in $/MWh and divide by 10.
Natural Gas Prices 1990’s to 2013 Marginal cost for natural gas fired electricity price in $/MWh is about 7-10 times gas price
Key Driver for Renewables: Concerns about Global Warming Value wasabout 280ppm in 1800; in 2013 it is 396 ppm Source: http://www.esrl.noaa.gov/gmd/ccgg/trends/
Worldwide Temperature Graph Baseline is 1961 to 1990 mean Source: http://www.cru.uea.ac.uk/cru/info/warming/
Looking Back a Little Further With lots more uncertainty! Source: http://www.econ.ohio-state.edu/jhm/AGW/Loehle/SupplementaryInfo.pdf
Going Back Further it Was Mostly Cold! http://commons.wikimedia.org/wiki/File:Ice_Age_Temperature.png
natural forcing only anthropogenic forcing only natural +anthropogenic forcing Compelling Evidence? natural (solar + volcanic) forcing alone does not account for warming in the past50 years • "With four parameters I can fit an elephant and with five I can make him wiggle his trunk." — John von Neumann adding human influences (greenhouse gases + sulfate aerosols) brings the models and observations into pretty close agreement Source: Prof. Gross Fall 2013 ECE 333 Notes
And Where Might Temps Go? The modelsshow rate of increase valuesof between0.18 to 0.4 C per decade.The rate from1975 to 2005was about 0.2 C per decade. Source: http://www.epa.gov/climatechange/science/future.html#Temperature
Brief History of Electric Power • Early 1880’s – Edison introduced Pearl Street dc system in Manhattan supplying 59 customers within a one mile radius • 1884 – Sprague produces practical dc motor • 1885 – invention of transformer • Mid 1880’s – Westinghouse/Tesla introduce rival ac system • Late 1880’s – Tesla invents ac induction motor • 1893 – First 3-phase transmission line operating at 2.3 kV, 12 km in Southern California
History, cont’d • 1896 – ac lines deliver electricity from hydro generation at Niagara Falls to Buffalo, 20 miles away • Early 1900’s – Private utilities supply all customers in area (city); recognized as a natural monopoly; states step in to begin regulation • By 1920’s – Large interstate holding companies control most electricity systems; highest voltages were 200 kV
History, cont’d • 1935 – Congress passes Public Utility Holding Company Act to establish national regulation, breaking up large interstate utilities (repealed 2005) • 1935/6 – Rural Electrification Act brought electricity to rural areas • 1930’s – Electric utilities established as vertical monopolies