Download
1 / 21
270 likes | 882 Vues
PERFUSION MRI IMAGING. Dr. Mohamed El Safwany , MD. Intended learning outcome. The student should learn at the end of this lecture principles of Perfusion MRI studies. Perfusion imaging. Definitions Principles Some more definitions Perfusion technique Applications Future. Definitions.

E N D
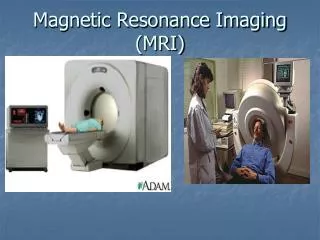
PERFUSIONMRI IMAGING Dr. Mohamed El Safwany, MD.
Intended learning outcome The student should learn at the end of this lecture principles of Perfusion MRI studies. .
Perfusion imaging • Definitions • Principles • Some more definitions • Perfusion technique • Applications • Future
Definitions • Perfusion is refer to the delivery of oxygen and nutrients to the cells via capillaries • Perfusion is identified with blood flow which is measured in milliliters per minute per 100 g of tissue
Principles After injection of a contrast agent • In normal brain, the paramagnetic contrast agent remains enclosed within the cerebral vasculature because of the blood brain barrier • The difference in magnetic susceptibility between the tissue and the blood results in local magnetic field finally to large signal loss
Some more Definitions • rCBF “ the rate of supply of Gd chelate to a specified mass ” ( ml / 100g / min) • rCBV - “ the volume of distribution of the Gd chelate during its first passage through the brain ” ( % or ml / 100g ) • MTT - “ the average time required for any given particle to pass through the tissue, following an idealised input function ” (min or s) MTT = rCBV / rCBF
Passage of Gd. can be followed by the changes in the relaxation rates concentration of local contrast. • Linear relation bet. concentration and rates of signal changes can be expressed as curve. • Tissue contrast concentration time curve can be used to determine tissue micro vascularity, volume and flow.
At each voxel we observe : slice n ~ ‘mean transit time’ time Integral:= cerebral blood volume intensity time
Principles • Each one of these effects is linearly proportional to the concentration of the paramagnetic agent • To date, this technique results in non-quantitative perfusion parameters (like rCBV,rCBF or MTT) because of the ignorance of the arterial input function
Hemodynamics Bl. volume Bl. flow Aim 1. Diagnosis 2. Monitoring management 3. Understanding intracranial lesions Dynamic MR perfusion
rCBV rCBV, processed with “Negative Enhancement Integral”(NEI) is related to area under curve
MTT MTT is related to the time to peak and to the width of the peak ; it is processed with “Mean Time to Enhance“(MTE)
Cerebral blood perfusion by bolus tracking Requires very high speed imaging power injector - Gadolium 5ml/sec Procedure : 1 - Start Imaging 2 - Inject Contrast* 3 - Continue Imaging 10 slices - 50 images of each slice - TOTAL time 1:34 min *Push Gadolinium with 20 cc of saline flush
Applications of Perfusion MRI • Neurology • Neuro-oncology • Neurophysiology • Neuropharmacology
Stroke Perfusion Imaging: Findings in Infarction • CBV • regional perfusion deficit • compensatory increased volume • MTT • regional prolongation of transit time
Findings with Perfusion imaging for Neuro-oncology • Critical imaging to BBBB imaging of neoplasm • many tumors have high rCBV • regions of increased rCBV correlate with areas of active tumor. • heterogeneous patterns of perfusion suggest high grade • radiation necrosis typically demonstrates low rCBV • Lesion characterization may be possible • meningiomas have very high CBV in contrast to schwannomas
Neuro-oncology rCBV maps • low rCBV in tumour infers low grade glioma
Text Book David Sutton’s Radiology Clark’s Radiographic positioning and techniques
Assignment Two students will be selected for assignment.
Question Describe the rCBF, rCBV & MTT?